AI Image Analysis Toolbox for Cell Biology
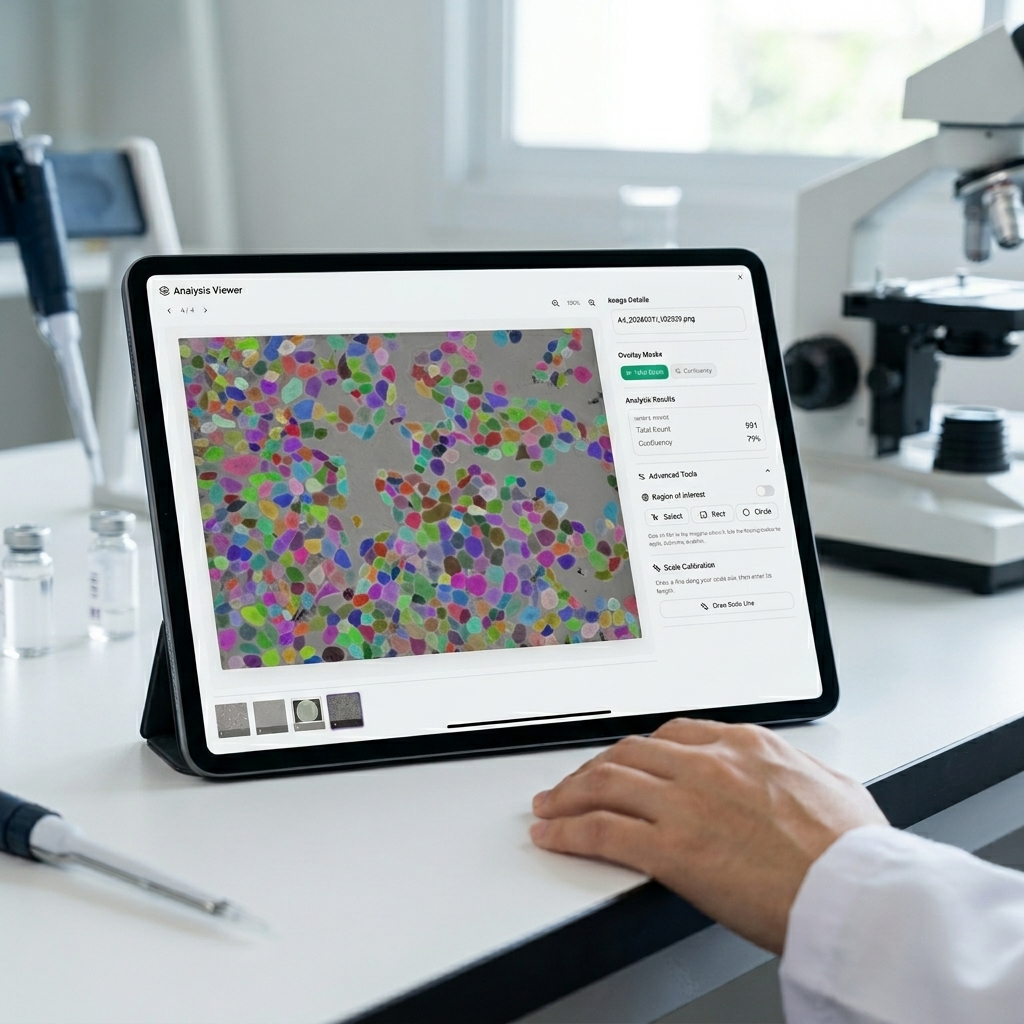
Cell growth, hemocytometer counting, and invasion assays from a brightfield image. No coding, no thresholding, no plugins. Sign up free and get 25 credits.
Available assays
What Can You Analyze Today?
Whole image analysis
Cell Count 82
Cell Confluency 28%
Cell growth
Measure confluency and adherent count from one brightfield image
Track growth curves, measure doubling time, standardize seeding density, or confirm confluency before treatment. No staining. No destructive sampling.
- Confluency % per image
- Cell count per image
- Growth curves with SEM across replicates
- Brightfield only. No staining required
Whole image analysis
Total Count 144
Live Cells 38
Viability 25%
Cell/Ml 2.9e+06
Cell growth
Suspension cell count with automatic concentration calculation
Upload a brightfield hemocytometer image. Set your dilution factor, toggle Trypan Blue if you used it. SnapCyte® calculates cells/mL automatically.
- Total, live, and dead cell counts
- Cells/mL with dilution factor applied
- Trypan Blue viability detection
- Works with phone images or digital microscope
Whole image analysis
Stained Cells 64%
Invasion assay
Automated transwell invasion quantification
Replaces manual counting and custom macros. Upload crystal violet-stained membrane images and get invaded cell area as a percentage in seconds.
- % invaded cell area per image
- Consistent across all images and users
- Crystal violet stain. No extra reagents or special plates.
- Works with phone or digital microscope
Workflow
From bench to results in minutes
Capture Your Image
Brightfield at 10x is enough for all three assays. Use any digital microscope or your phone with a microscope adapter. For the fastest workflow, use the SnapCyte Lens® app to capture and send images directly to the platform.
Upload & Set up Analysis
Upload your image to SnapCyte™ for instant AI analysis, or set up a timelapse experiment to track cell changes over time.
Get Results
Receive instant insights, including quantitative measurements, graphs and statistical error calculations, eliminating manual work.
SnapCyte® vs other free tools
Why scientists switch from manual and free tools
Manual counting is slow and inconsistent. Free tools like ImageJ and CellProfiler require macros, plugins, and threshold tuning that breaks when imaging conditions change. SnapCyte® applies the same trained model to every image. Same rules, every time, every user.
| Manual & free tools | SnapCyte® | |
|---|---|---|
| Setup required | Macros, plugins, manual thresholds | None. Upload and go |
| Consistency across users | Threshold-dependent, varies | Same model, every image |
| Label-free brightfield | Limited, often needs staining | Yes , no staining required |
| Time per experiment | Hours | Under 20 minutes |
| Statistical outputs | Manual in Excel | Automatic; mean, SD, export ready |
What scientists say
Trusted in labs worldwide
Track Cell Growth From Images
Sign up free. Get 25 credits. No credit card required.
Frequently asked questions
What type of microscope or camera do I need?
SnapCyte™ works with digital microscopes or smartphones with a microscope adapter. High-quality, well-focused images produce the best results.
Can I capture images from my phone?
Yes. Install SnapCyte Lens®, a free PWA, on your iOS or Android device. Open it in your phone’s browser, add it to your home screen, and you’re set. Images sync automatically to your experiment in the SnapCyte Capture tab. See install guide →
How does SnapCyte™ count cells in hemocytometer images?
SnapCyte™ detects individual cells from standard hemocytometer images. No manual counting required.
Where can I find setup guides and troubleshooting help?
Visit our Help Centre for step-by-step guides on capturing images, setting up experiments, and optimizing analysis with SnapCyte™.