Hemocytometer Count: AI cell counting in seconds.
Cell counting is one of the most routine measurements in cell biology, but it is also one of the first places where variability enters an experiment. Small differences in counting rules, sample preparation, detachment, viability staining, or image quality can affect seeding density, growth curves, drug response data, and downstream analysis.
SnapCyte® provides image-based cell count workflows for hemocytometer images, helping researchers reduce manual counting and standardize results across users.
What it measure?
Multiple readouts. One image.
Works with or without Trypan Blue. Set your dilution factor once, SnapCyte® does the math.
Total cell count
AI detects and counts every cell in the hemocytometer square automatically. Readmore on AI reproducibility in cell count.
Live & dead counts
Toggle Trypan Blue on in Assay Settings to get separate live and dead counts with viability %.
Cells/mL
Automatic: average count × dilution factor × 10⁴. No manual math needed.
Viability %
Live cells as % of total. Reported per image and averaged across four corner squares.
💡 If your cells are adherent and you want a count directly from your flask or plate without trypsinizing, use the Cell Growth assay instead.
When to use it
Common use cases
Before seeding
Count cells after trypsinization to seed at the right density.
Viability check
Confirm cells are healthy before starting an experiment with Trypan Blue.
Suspension cultures
Count naturally suspended cells without trypsinization.
Record keeping
Track passage counts and cell density over the course of an experiment.
Reproducibility
Replace manual counting — same model, same rules, no inter-user variability.
Workflow
From bench to results in minutes
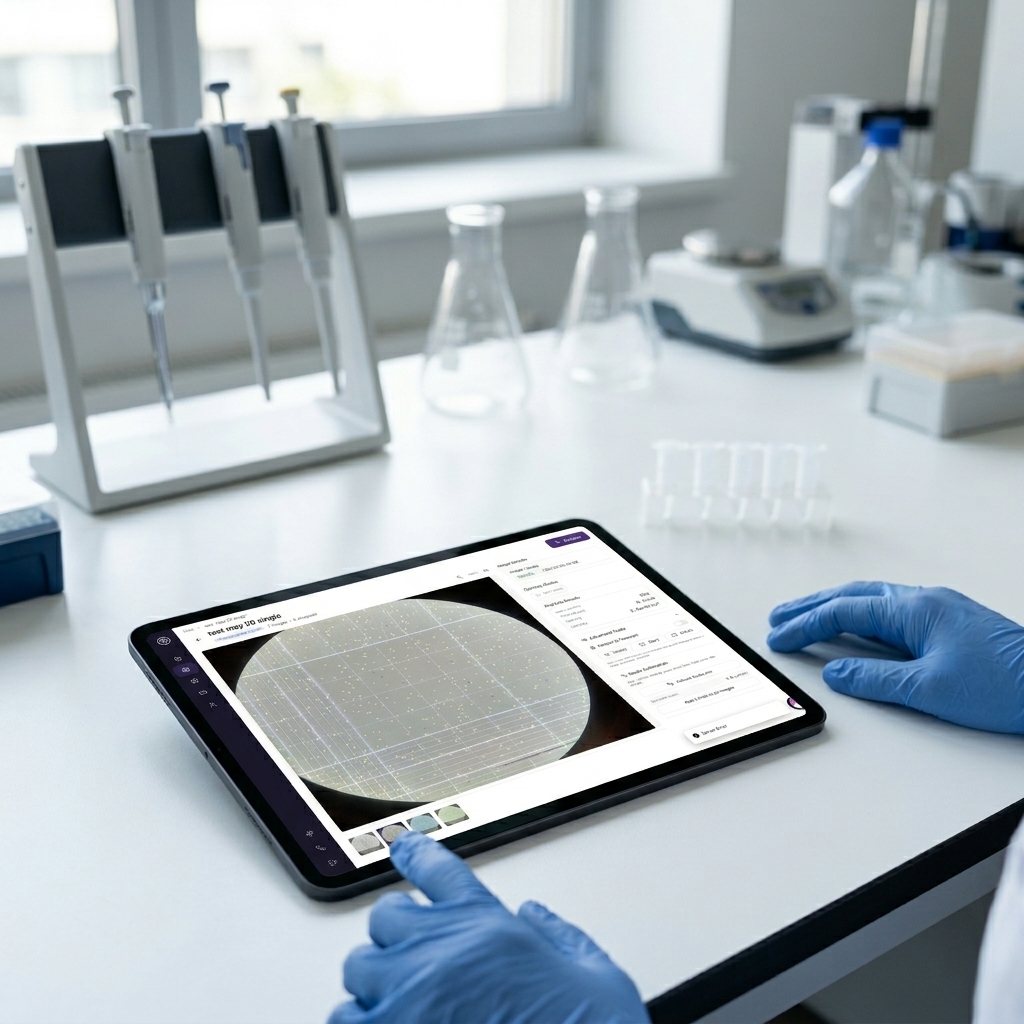
Load and image
Mix suspension well. If using Trypan Blue, mix 1:1 (dilution factor = 2). Load 10–20 µL into hemocytometer. Allow cells to settle. Image each of the four corner squares separately at 10x.
Configure and organize
Before uploading, set your dilution factor in Assay Settings and toggle Trypan Blue on or off. Organize your four square images in to separate groups. Draw an ROI on each to frame the hemocytometer square.
Review and export
Count, viability, and cells/mL per image. Spot check 3-5 images for Accuracy. In results tab view the average across your four squares per group (Group-level mean and SEM). Export to Excel.
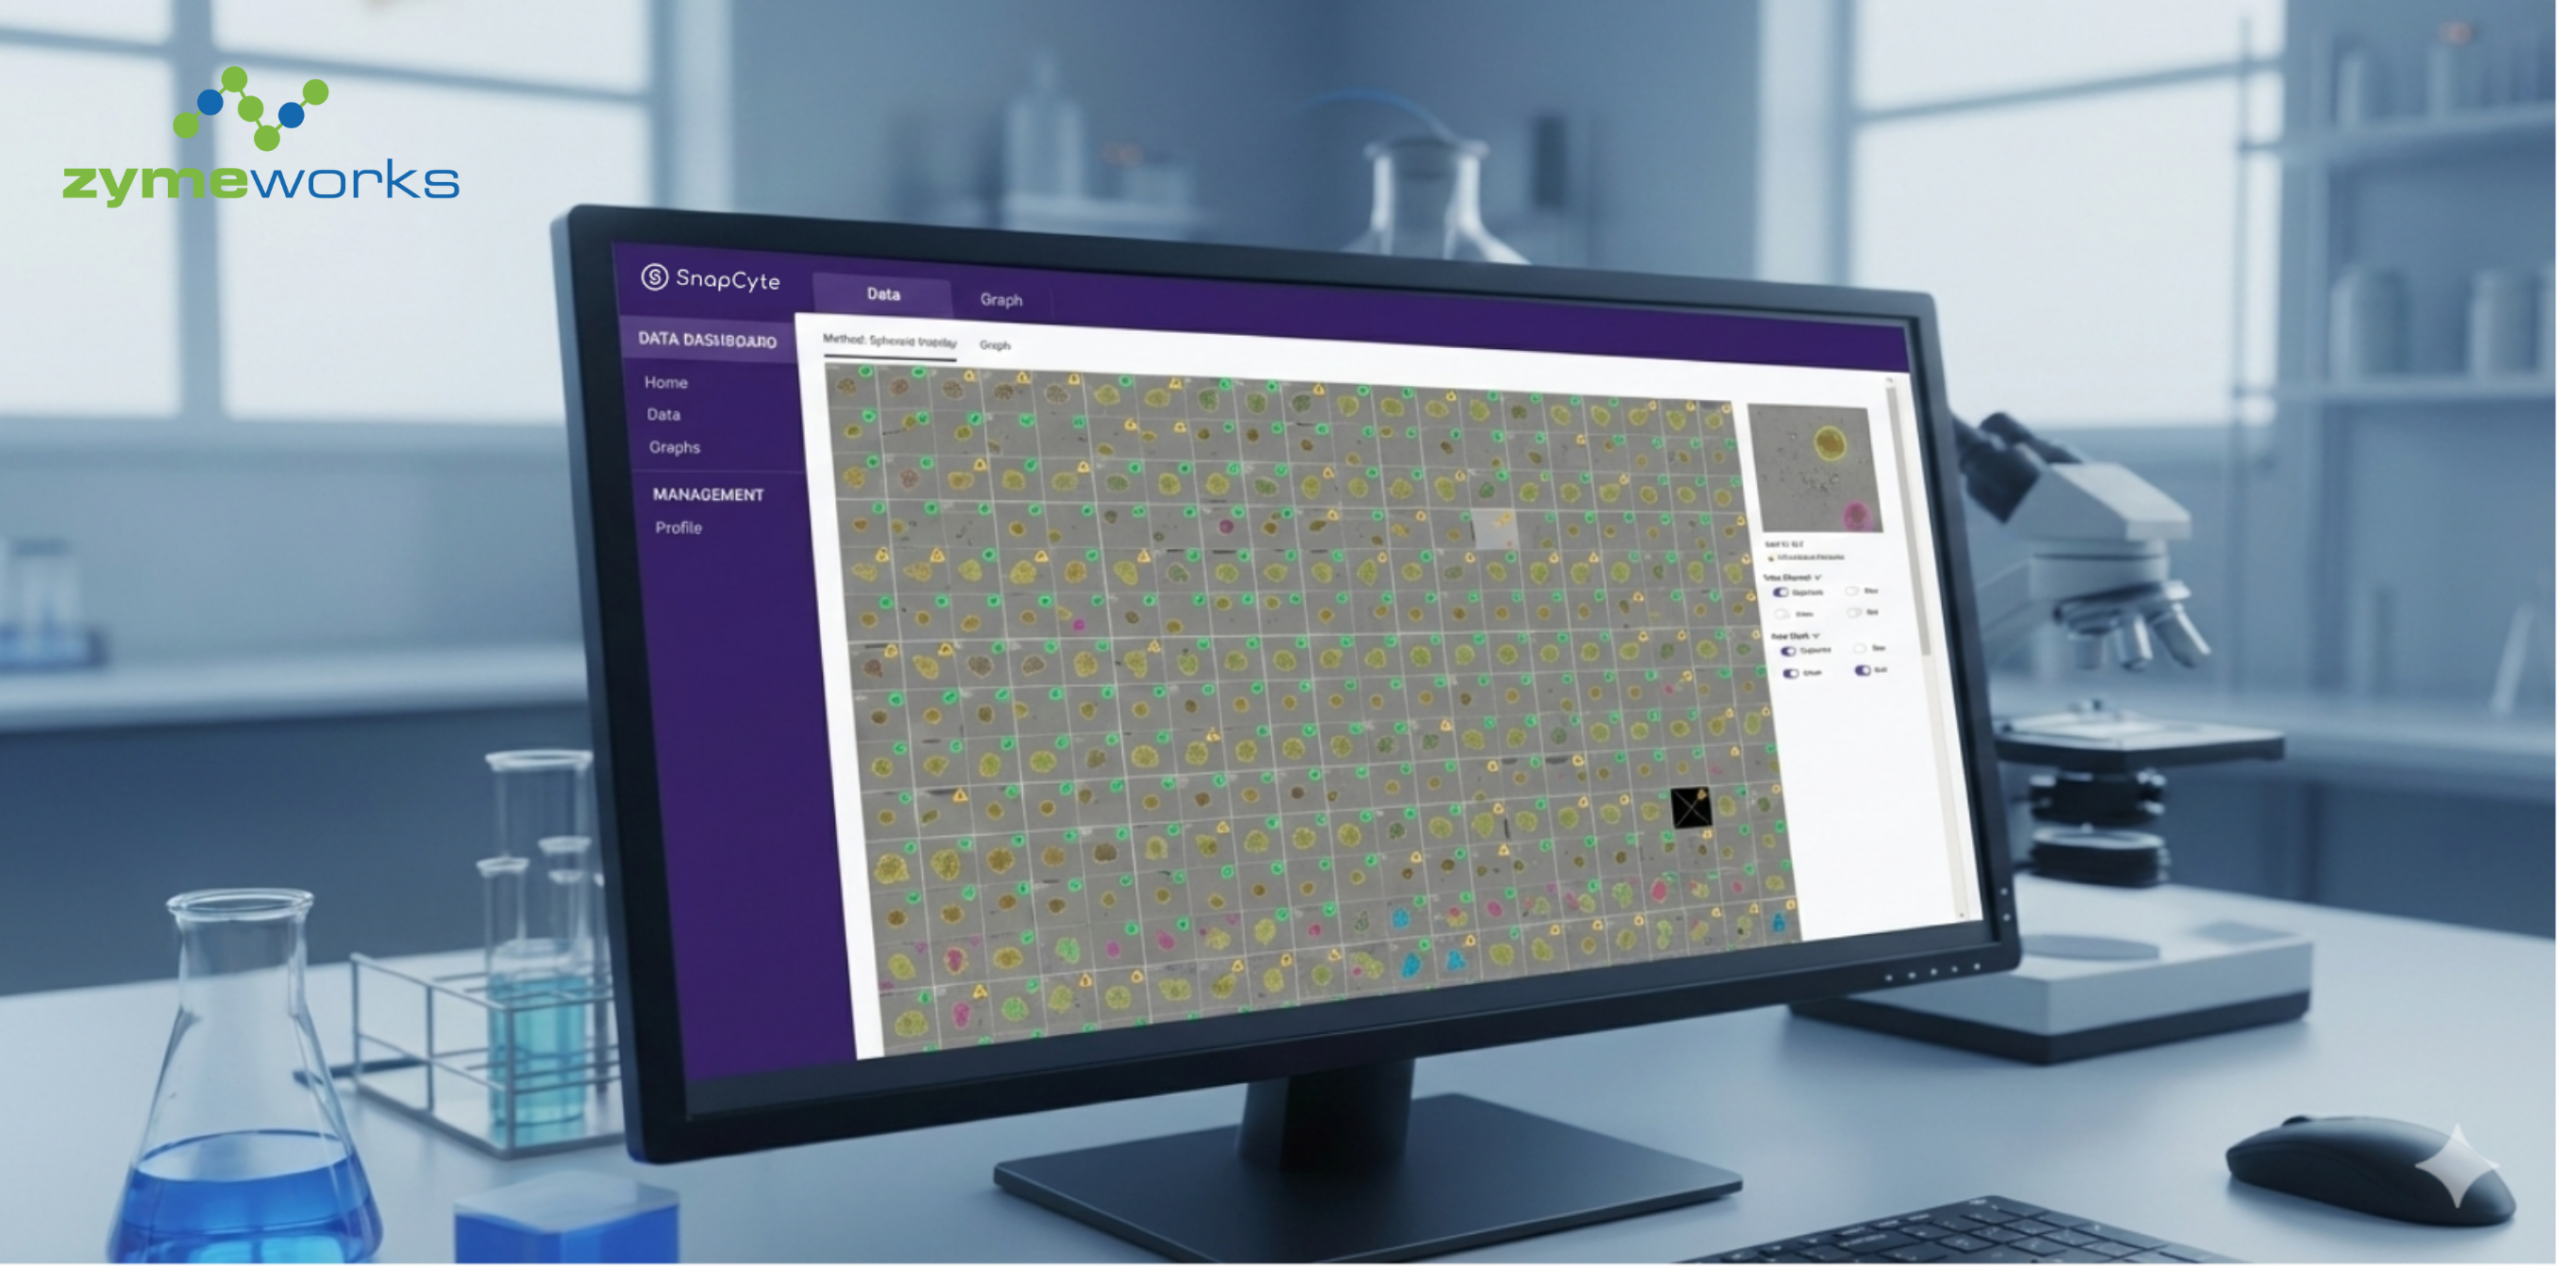
Example output
What your results look like
Confluency measures how much of the image area is covered by cells. Cell count measures how many cells are present. These two metrics are related, but they are not the same.
A culture can become more confluent because cells divide, but it can also become more confluent because cells spread out, flatten, or change morphology. This is why confluency alone can overestimate growth in some experimental conditions.
By pairing confluency with adherent cell count, SnapCyte® helps researchers distinguish true changes in cell number from changes in cell morphology or surface coverage.
For a full breakdown of why confluency and cell count are not interchangeable, see our article on why cell confluency alone can fail as a growth readout.

Hemocytometer with Trypan Blue. Live cells (green), dead cells (red), ROI drawn on one corner square.
Tips
- Always image the four corner squares separately and average.
- Draw an ROI on each image to frame the hemocytometer square and exclude grid edgs.
- Make sure cells are well suspended before loading.
- If you forgot to set your dilution factor before uploading, update it in Assay Settings. Results recalculate automatically.
- Allow cells to settle before imaging. Floating cells will be out of focus and missed.
Track Cell Growth From Images
Sign up free. Get 25 credits. No credit card required.
Frequently asked questions
Most Frequent Questions and Answers
What types of hemocytometers are compatible with SnapCyte™?
SnapCyte™ can work with various hemocytometers, but the automated calculation is specifically designed for those with a 0.1 mm chamber depth. Compatible types include Neubauer, Improved Neubauer, Bürker, and Bürker-Türk hemocytometers. While SnapCyte™ can still process images from hemocytometers with different depths, you will need to manually adjust the calculations.
What magnification should I use for capturing images?
Use 10X magnification to ensure clear imaging of the hemocytometer’s grid lines and cells.
Do I need viability dyes for accurate cell counting?
For viability assessment, Trypan Blue is supported.
Can SnapCyte™ handle clumped or overlapping cells?
Yes. The AI is trained on complex samples and can segment overlapping cells with high precision.
What is the dynamic range of cell counts with SnapCyte™?
SnapCyte™ offers a much higher dynamic range of cell counting compared to manual methods, capable of accurately counting up to 10^7 cells. This extended range allows for precise analysis even in highly concentrated samples.
")