Introduction
Cell counting is one of the most routine measurements in cell biology. It determines how many cells are seeded, how doubling time is calculated, how drug response data are normalized, and whether experiments begin under consistent conditions. Because this process is performed so frequently, it is often assumed to be objective.
In reality, cell counting is one of the earliest points where experimental variability and reproducibility issues begin. Small inconsistencies at the counting stage can quickly amplify across growth curves, drug response assays, migration studies, and transcriptomic experiments.
This is not just a technical issue. It is a measurement problem. To understand where variability enters the workflow, it is helpful to examine the two most common counting approaches used in laboratories: suspension cell counting and adherent cell counting.
Suspension Cell Counting
What Is Suspension Cell Counting?
Suspension cell counting is one of the most common methods used to measure the number of cells in a culture. Suspension cell counting measures cells in a defined volume using a hemocytometer or automated counter, often with viability dyes such as trypan blue or erythrosin B.
The traditional manual workflow using a hemocytometer appears straightforward.
First, the cell sample is diluted to an appropriate concentration. In practice, this typically means a range of approximately 1 × 10⁵ to 1 × 10⁶ cells/mL, which allows for a manageable number of cells (often ~50–200 cells per grid) to be counted accurately without overcrowding or excessive empty space. The sample is then mixed thoroughly to ensure an even distribution of cells. A small volume is loaded into the counting chamber. Cells within the grid boundaries are counted under a microscope, and the concentration of cells per milliliter is calculated using the chamber volume.
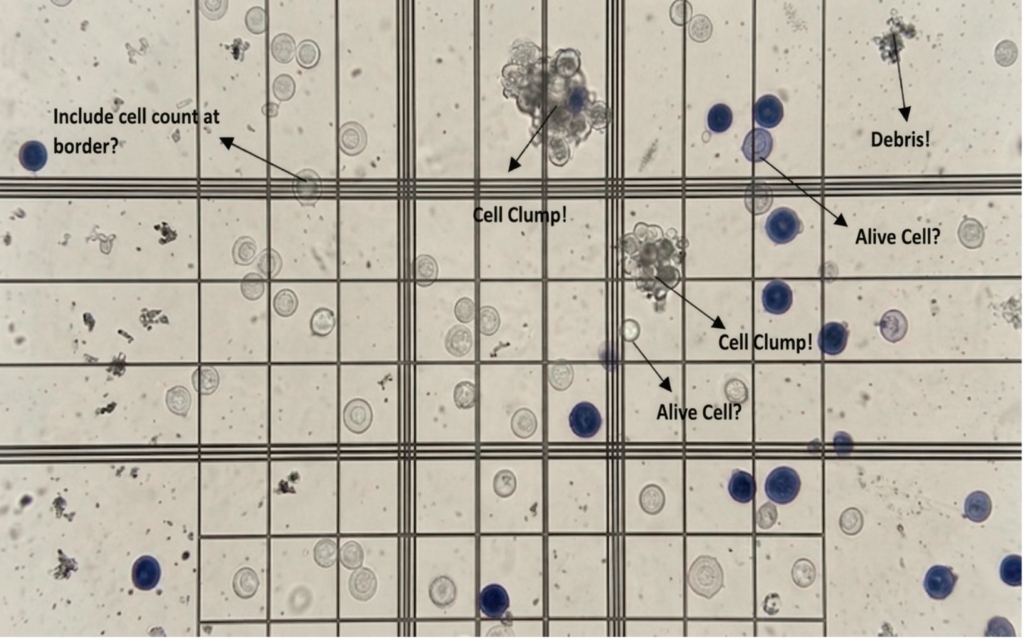
Although using a hemocytometer seems straightforward in principle, it leaves plenty of room for human error. Should cells touching the border be counted or excluded? Is that object a live cell, dead cell, debris, or just an air bubble? Even viability dyes do not always give a clear answer, since some dead cells may not stain a strong blue right away. These small judgment calls can introduce variability between users and measurable differences in cell count.
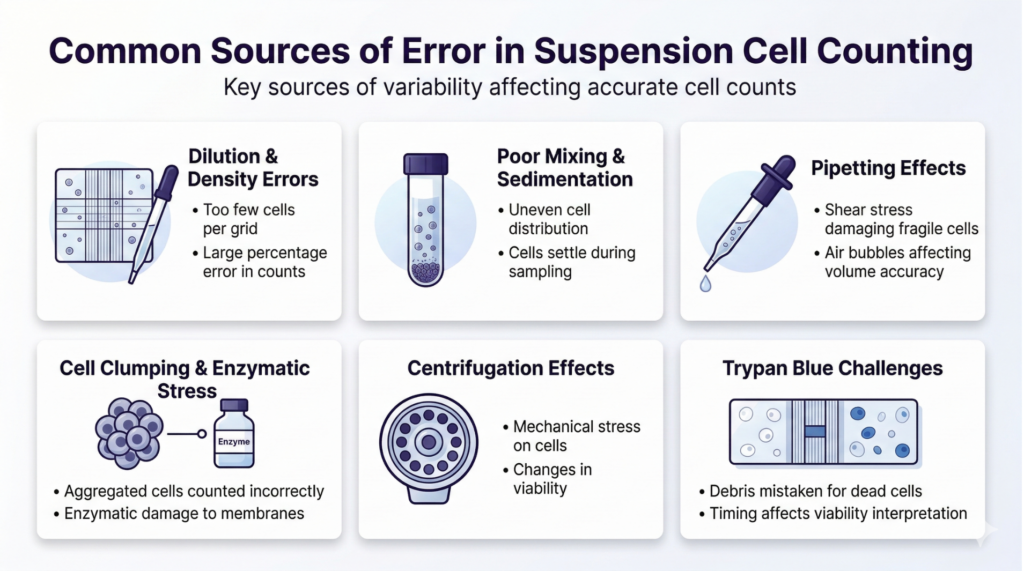
Sources of Variability in Suspension Counting
Automated Cell Counting
To reduce manual effort and variability, many laboratories now use automated cell counters. These instruments streamline the process by capturing images of the sample and calculating cell numbers automatically. Automated systems can improve speed and reduce fatigue-related error, especially when large numbers of samples are being processed.
However, automated cell counting does not eliminate variability entirely. These systems still depend on sample quality, threshold settings, focus, chamber loading, and the instrument’s ability to distinguish true cells from debris, aggregates, and staining artifacts. Different devices may also apply different classification rules, which means the same sample can still produce slightly different results depending on the platform used.
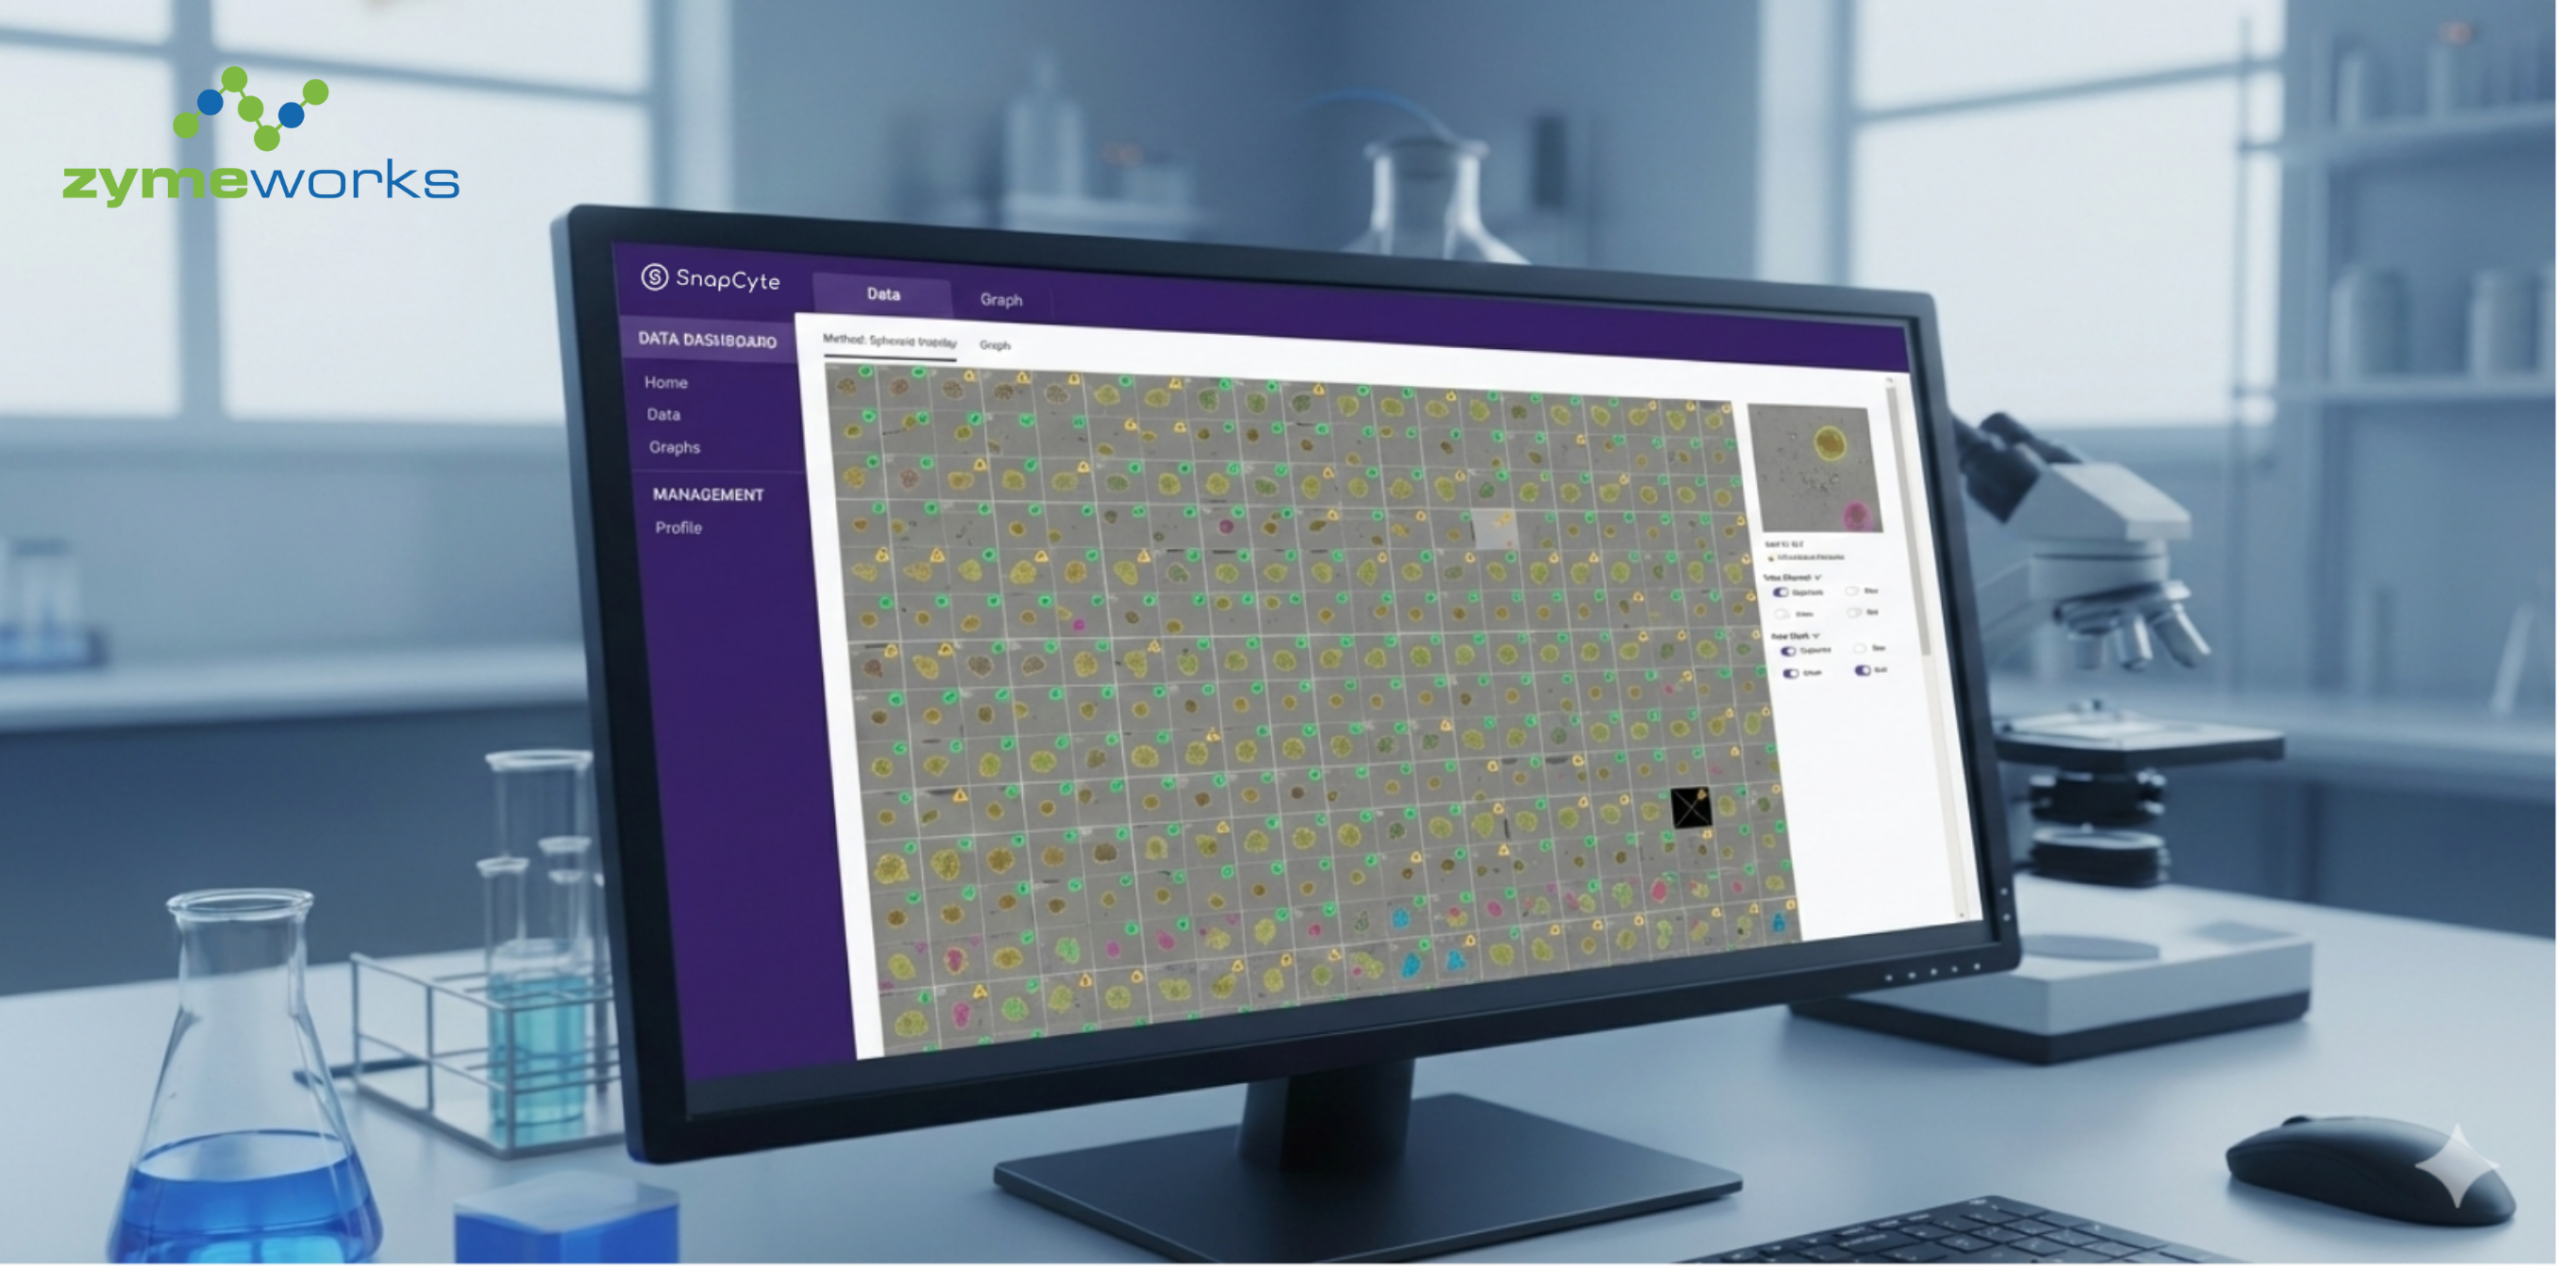
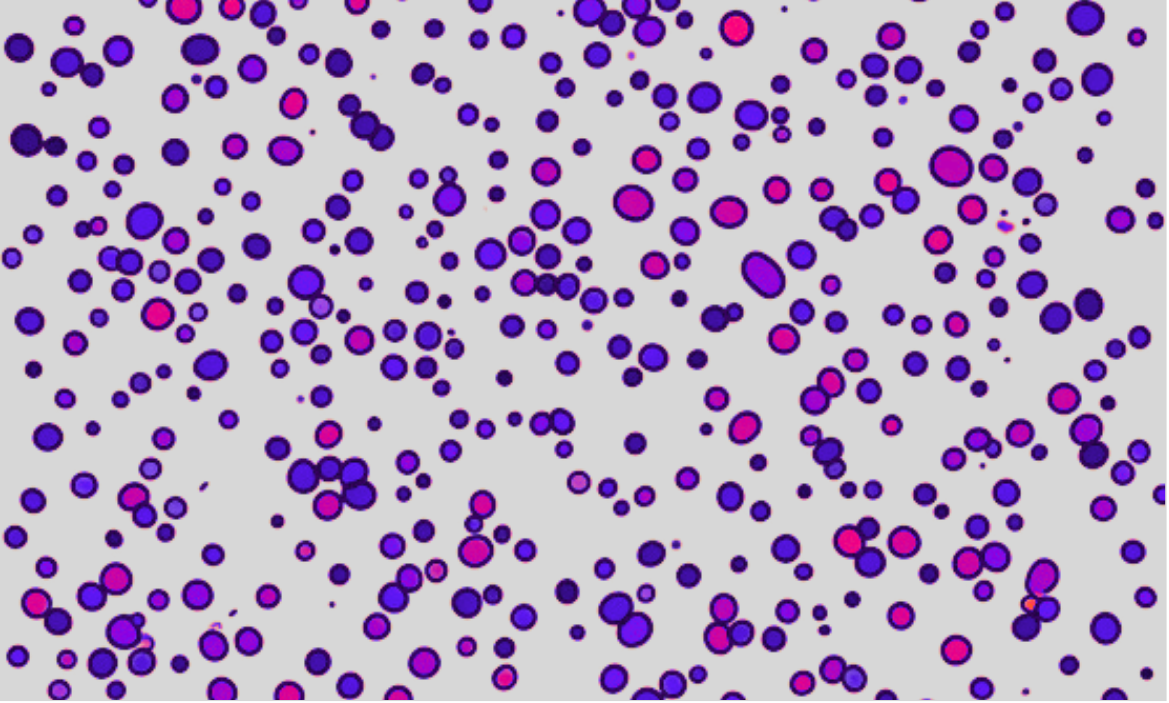
In addition to traditional automated counters, AI image analysis platforms are becoming increasingly popular. For example, SnapCyte allows researchers to upload hemocytometer images and automatically calculate cell counts using image segmentation. This approach reduces human interpretation and improves consistency between users.
SnapCyte can also analyze cells stained with trypan blue or erythrosin B, helping distinguish viable cells from non viable cells while preserving the traditional counting workflow.
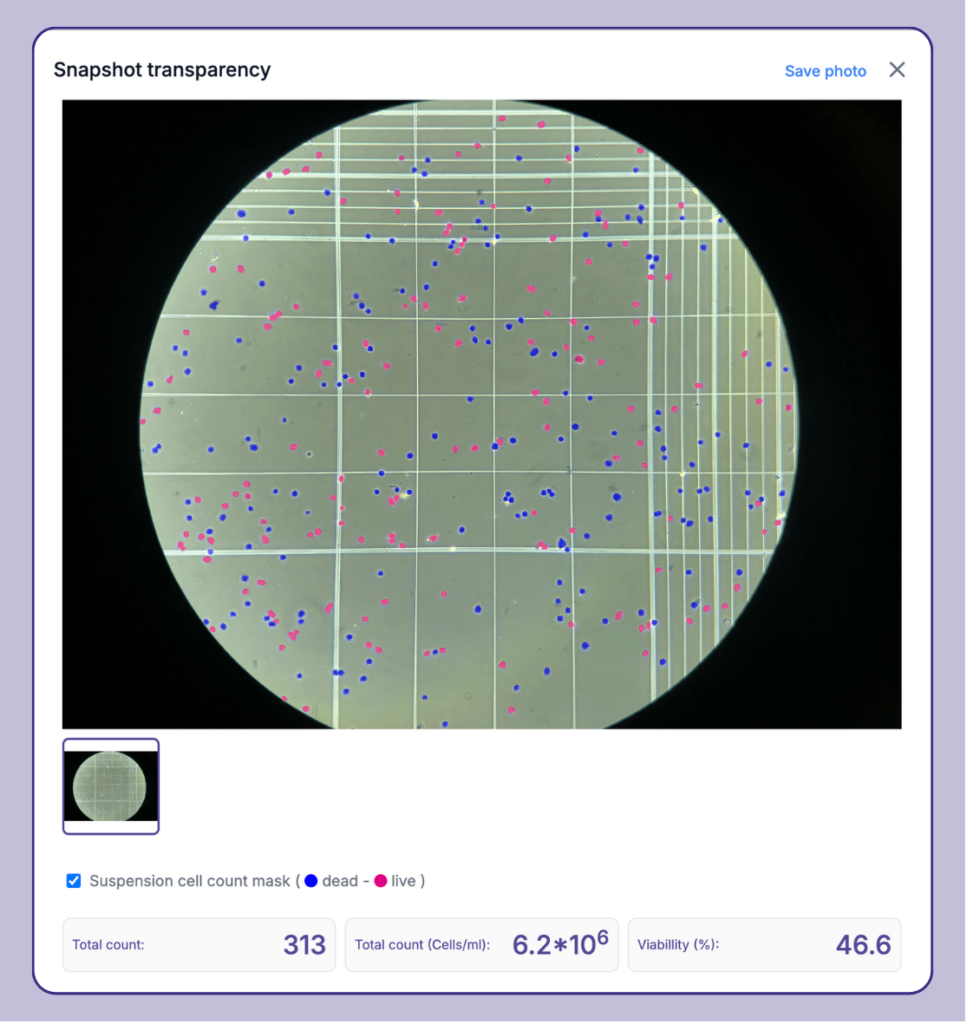
This is exactly the type of variability that AI image analysis is designed to reduce; not just automating the workflow, but standardizing how cell count is measured across samples, users, and experiments.
Adherent Cell Counting
The second major category of counting occurs with adherent cells. Unlike suspension cells, adherent cells grow attached to a surface, usually a culture dish or well plate.
Traditionally, these cells must first be detached before they can be counted. Researchers commonly use trypsin or salt based dissociation solutions to release the cells from the surface. Once detached, the cells are resuspended in media and counted using the same suspension methods described earlier.
Although this workflow is widely used, it introduces additional sources of variability.
How Detachment Alters Biology
Trypsin works by breaking down proteins that help cells attach to surfaces. During this process, important membrane proteins may be removed and cell structure can be temporarily disrupted.
For some cell types, this can make the cells fragile. It may also alter receptor expression, affect extracellular signaling, or change transcriptional activity. In some cases, cells may experience delayed cell death that is not immediately visible during counting.
Importantly, not all cultures tolerate detachment equally. Sensitive systems—such as primary cells—may undergo significant cell death or lose their ability to reattach after detachment. In mixed cell populations, this process can also introduce bias by selectively enriching for more resistant cells while more fragile subpopulations are lost.
This is particularly critical when working with primary cells, studying extracellular signaling pathways, or performing transcriptomic analyses. The act of detaching the cells can unintentionally change the very biology that the experiment aims to measure.
Increased Variability During Detachment
The traditional approach to counting adherent cells requires dissociating them into a suspension before measurement. This introduces additional variability, as enzymatic exposure times must be carefully optimized.
If exposure is too short, cells may remain clumped together. If exposure is too long, cells may become stressed or damaged. Furthermore, cells that appear healthy immediately after detachment may undergo latent cell death later, which may not become apparent until the experiment is already underway. This means that the final cell count does not only reflect how many cells were present in the culture. It also reflects how successfully those cells were detached, preserved, and resuspended.
Why Confluency and Cell Count Are Not the Same
In adherent workflows, cell count and confluency are closely related, but they are not interchangeable.
Cell count reflects the number of cells present.
Confluency reflects how much of the surface is covered.
For example, a culture of many small cells may have a high cell count but lower surface coverage than a culture of fewer large, spread cells. This is one reason visual estimates of culture readiness can be misleading.
For a deeper explanation of what confluency measures and why it is often misunderstood, see our guide on cell confluency measurement.
Image-Based Adherent Cell Counting
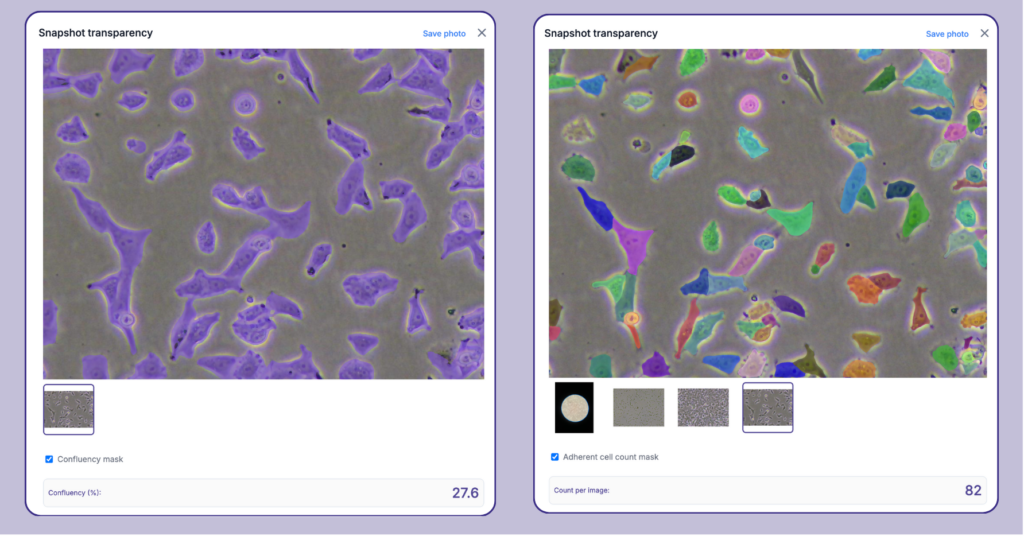
An alternative approach is to count adherent cells directly from microscopy images without detaching them. Using AI image analysis platforms such as SnapCyte, researchers can capture images of the culture and analyze them to determine both cell count and confluency.
This approach removes the need for enzymatic detachment and reduces many of the stresses associated with traditional workflows. By analyzing cells in their natural adherent state, researchers can preserve membrane proteins, maintain extracellular interactions, and avoid introducing unnecessary variability.
Image-based analysis also allows entire wells to be evaluated rather than relying on a few selected fields, improving consistency across experiments. In practice, cell counting from images typically relies on representative sampling, assuming that cell distribution across the culture surface is relatively homogeneous. When this assumption is uncertain, additional images can be acquired to cover a larger proportion of the vessel and averaged to improve accuracy.
Because this method is non-invasive and does not consume the sample, increasing sampling density is both feasible and practical, allowing researchers to achieve more robust and reliable measurements without compromising the experiment.
More importantly, AI image analysis reframes adherent cell counting as a standardized measurement problem rather than a workflow that depends heavily on detachment efficiency, user interpretation, and partial sampling.
For a step-by-step workflow on how to perform cell count directly from microscopy images, see our automated cell counting workflow.
Why Counting Accuracy Matters
Cell counting is often treated as a routine preparatory step, but it is actually a foundational measurement that influences the entire experimental pipeline. Errors introduced during counting can affect seeding density, growth rate calculations, assay normalization, and overall experimental reproducibility.
By understanding where variability originates and adopting more standardized approaches, researchers can significantly improve the reliability of their experiments.
In this context, combining complementary counting methods, such as traditional suspension-based counting and image-based analysis of adherent cells, can be particularly powerful. This dual approach allows researchers to confirm seeding accuracy, verify that sufficient cell numbers are available for downstream applications, and assess the homogeneity of the culture across the vessel.
This is also why cell counting fits naturally within a broader reproducibility framework. When the count is inconsistent, every downstream metric inherits that inconsistency. When the count is standardized, experimental interpretation becomes more reliable.
Ultimately, reproducibility in cell biology begins with accurate measurement.
And that measurement begins with the count.
If you want to standardize your cell counting and reduce variability across experiments, you can try SnapCyte® image-based cell analysis for free.

")
")
")