Cell Growth Assay: confluency and cell count from one brightfield image.
Cell growth is often tracked using confluency, but confluency alone does not always tell you whether cells are actually proliferating. Changes in cell shape, spreading, clustering, or treatment response can change surface coverage without changing cell number.
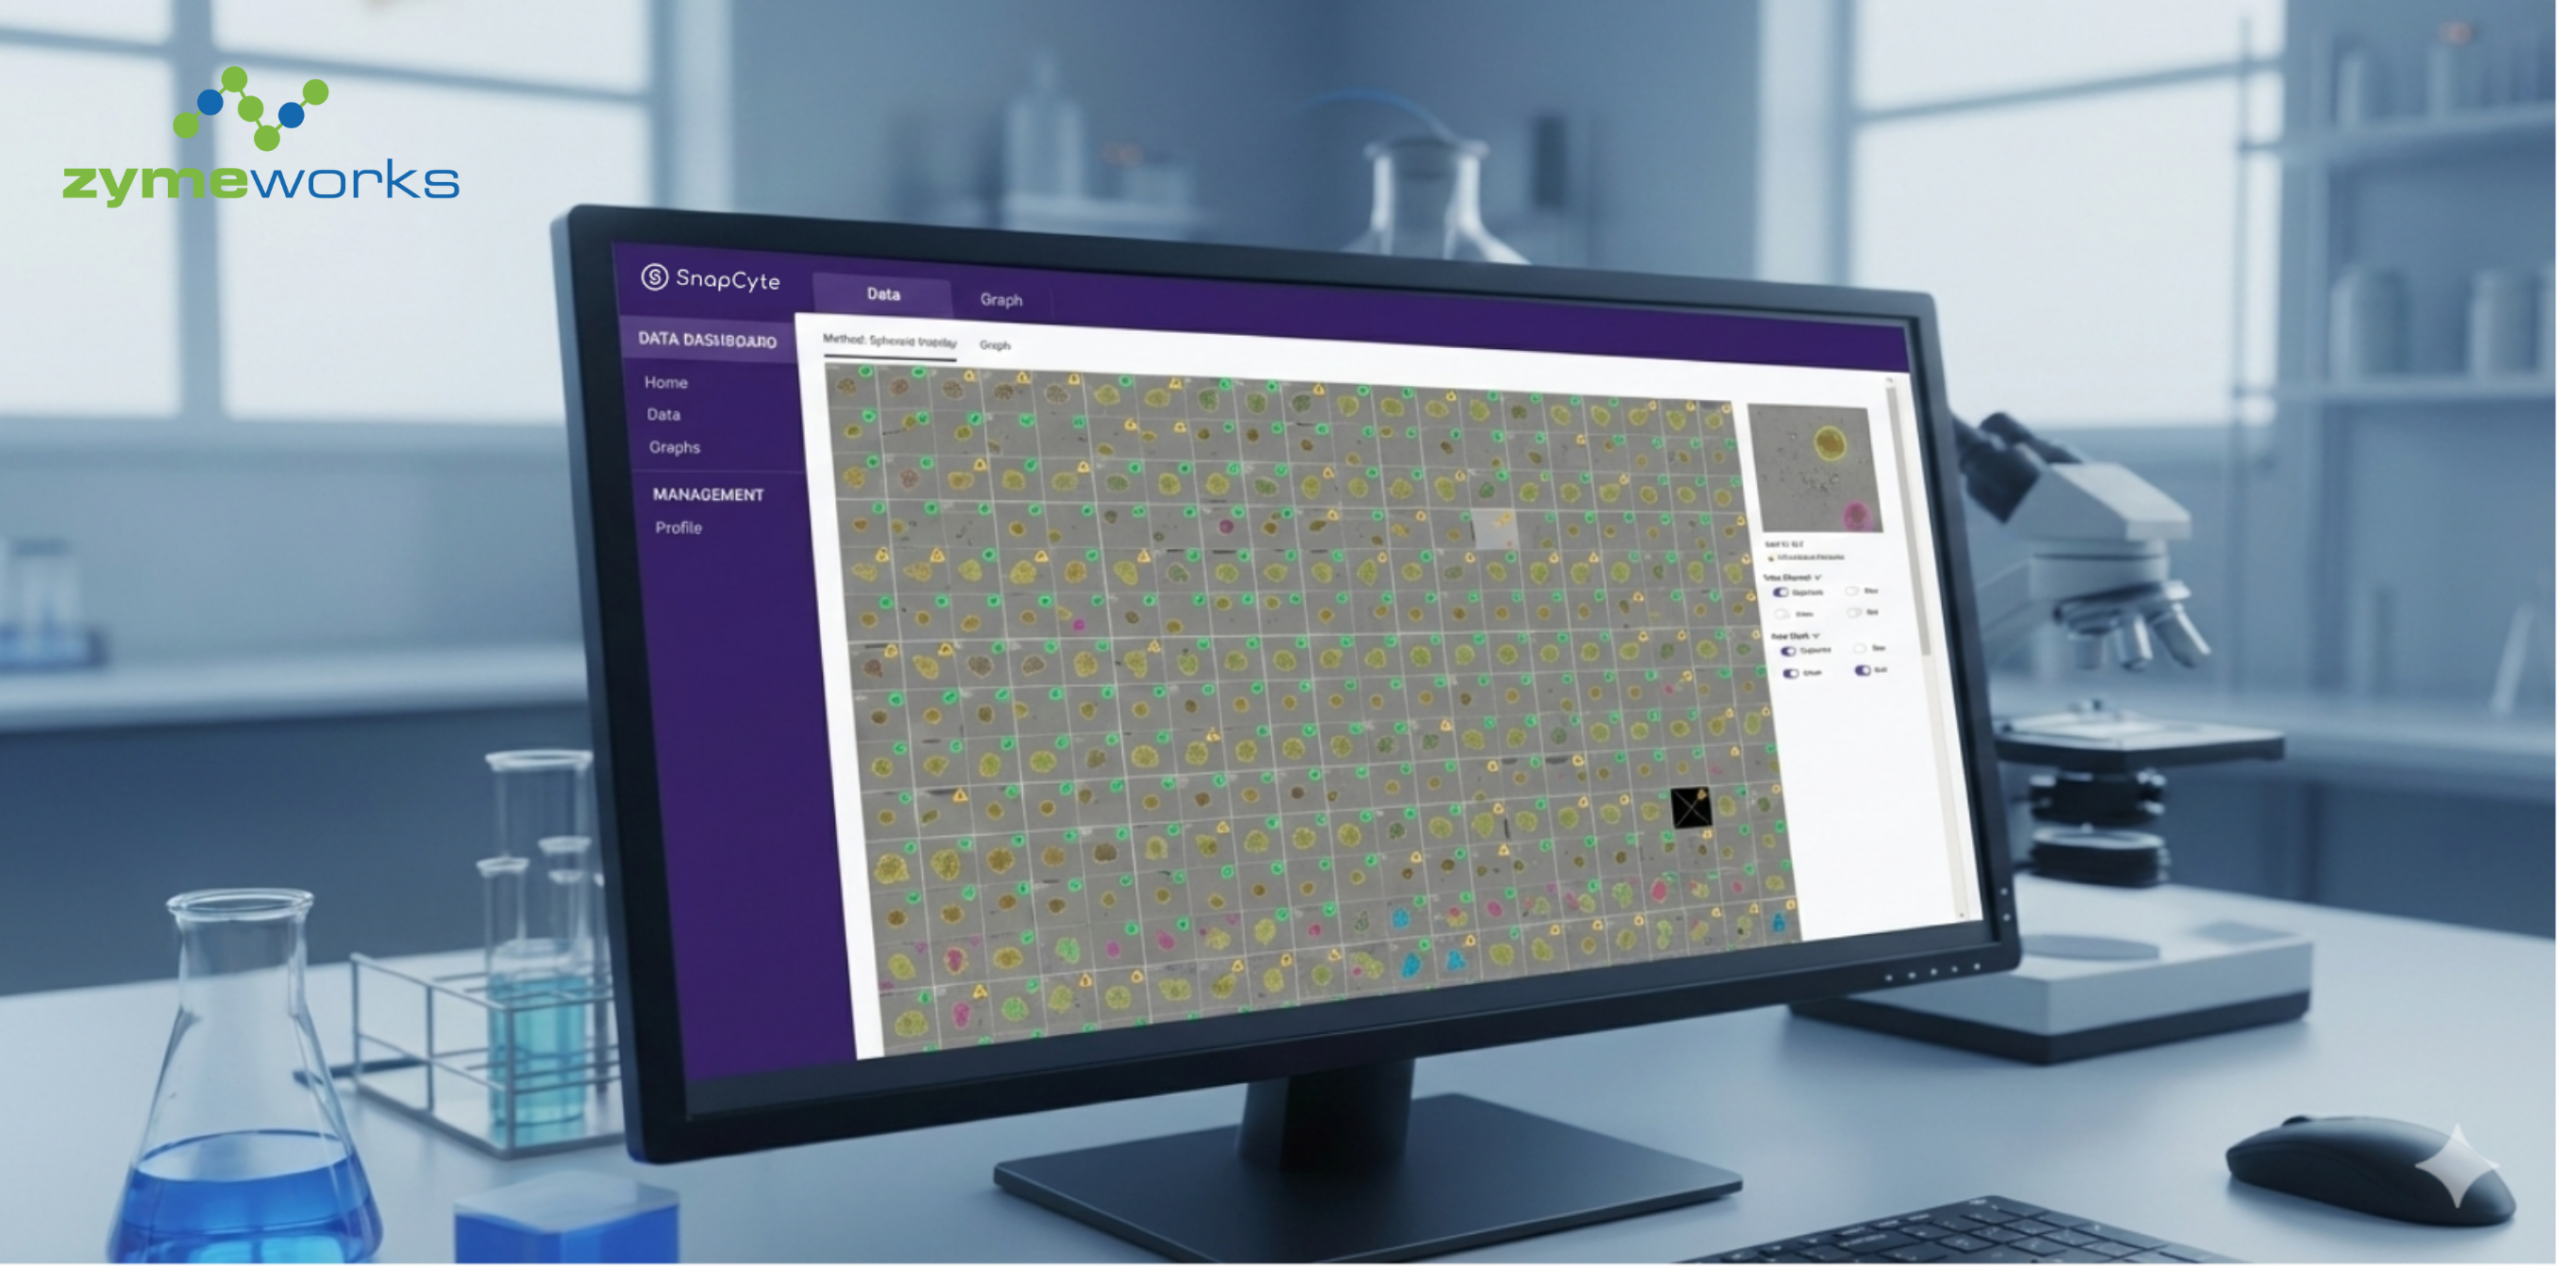
SnapCyte® measures both cell confluency and adherent cell count from brightfield images, giving researchers a clearer way to track growth, compare conditions, and reduce user-dependent interpretation.
What it measure?
Multiple readouts. One image.
No staining required. Your cells stay intact for downstream workflows.
Confluency %
Percentage of well surface covered by cells. Use for growth curves, doubling time, and pre-treatment checks. Read our guide on cell confluency measurement.
Adherent cell count
Total count of individual adherent cells per image, no trypsinization needed.
Cell density (cells/cm²)
Set a scale bar to get cells/cm². Calculate total cell concentration multiplied by vessel area.
Growth curves with SEM
Mean and SD automatically calculated across image replicates. Export-ready graphs per condition or across time point.
When to use it
Common use cases
Drug response
Measure the effect of a drug or treatment on cell proliferation over time.
Seeding standardization
Confirm cell density at plating before starting an experiment.
Doubling time
Estimate doubling time from image-based measurementsat regular time points.
Pre-treatment QC
Check confluency is at the right level before applying treatment.
Morphology changes
Track visible morphology changes under treatment in the same images.
Knockdown phenotype
Monitor growth effects after siRNA or CRISPR knockdown.
Workflow
From bench to results in minutes
Image your cells
Brightfield, 10x magnification. Digital microscope or phone with adapter. Image multiple spots in a well for statistical representation.
Upload and organize
Upload all images at once. Group by condition, organize by time point or plates if you have multiple cell lines. SnapCyte® calculates mean and SD across all images in one group.
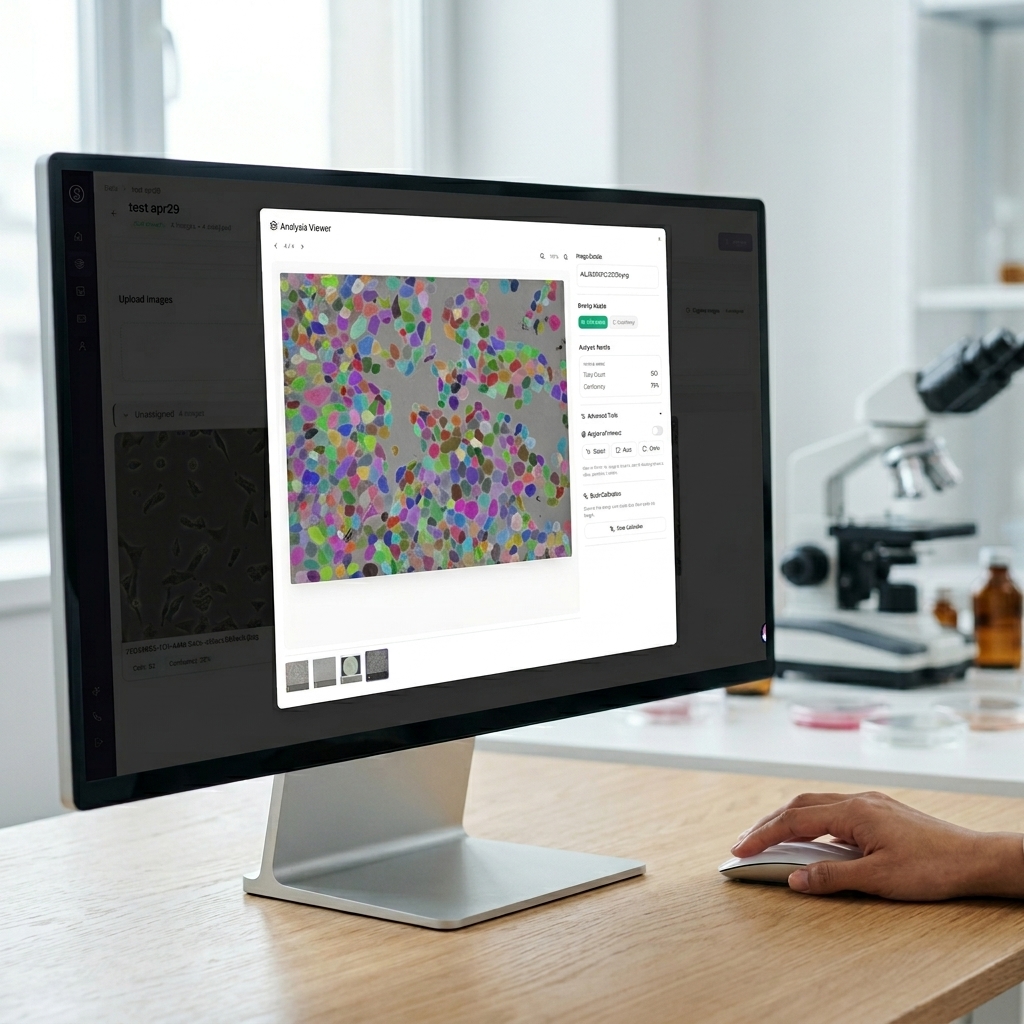
Review and export
Spot check 3-5 images for confluency and count masks. Download publication growth curves with stats, exportable to Excel.
Example output
What your results look like
Confluency measures how much of the image area is covered by cells. Cell count measures how many cells are present. These two metrics are related, but they are not the same.
A culture can become more confluent because cells divide, but it can also become more confluent because cells spread out, flatten, or change morphology. This is why confluency alone can overestimate growth in some experimental conditions.
By pairing confluency with adherent cell count, SnapCyte® helps researchers distinguish true changes in cell number from changes in cell morphology or surface coverage.
For a full breakdown of why confluency and cell count are not interchangeable, see our article on why cell confluency alone can fail as a growth readout.


Right: confluency overlay (28%). Left: per-cell segmentation (82 cells). Same image, two readouts.
Tips
- Keep the number of images per well consistent across all time points for meaningful SD.
- Make sure the empty black spaces are excluded using ROI feature. Any empty area counts as surface area and will lower your confluency reading artificially.
- Start at 20–40% confluency so you have room to track growth meaningfully over time.
- Don't image overconfluent wells. Once cells are growing on top of each other both confluency and count lose their meaning.
- If cells are clumping, confluency is still valid but cell count will be less accurate.
Case study
Used in real research
“SnapCyte® has offered us rapid assessment of seeding uniformity and preliminary confirmation of cell death, thereby serving as a valuable quality control tool. Before progressing to more specific and costly reagents, SnapCyte® ensures the efficiency of our experiments and treatments.”
Track Cell Growth From Images
Sign up free. Get 25 credits. No credit card required.
Frequently asked questions
Most Frequent Questions and Answers
How many images do I need from each well to obtain accurate, representative data?
The number of images needed per well depends on the format of the culture plate used and homogeneity of your culture. For example, in a 96-well plate, capturing 2 images at 10X magnification per well is typically sufficient for accurate data.
Do I need special equipment to capture images for SnapCyte™?
SnapCyte™ offers an adapter that allows you to acquire images using your smartphone and any basic microscope. It can also work with phase-contrast images taken with other microscopes, providing flexibility in how you capture and upload your data.
Can I track cell doubling time over time with SnapCyte™?
Yes, SnapCyte™ allows for continuous monitoring of cell proliferation by analyzing images captured at multiple time points, providing reliable data throughout your experiments.
Is there support available if I encounter issues using SnapCyte™?
Yes, SnapCyte™ offers comprehensive customer support, including detailed protocols and user guides in our help centre.
Related blog posts

- Blog Post
Adherent Cell Count: More Than Just a Number
- Nader Al Nakouzi
")
- Blog Post
Cell Counting in Cell Culture: How to Reduce Variability
- Nader Al Nakouzi
")