AI Image Analysis for Invasion and Migration Assays
Migration assays measure how cells move through a porous membrane toward a chemoattractant. Invasion assays use a similar setup, but include an extracellular matrix layer, such as Matrigel, so cells must invade through the matrix before reaching the membrane.
SnapCyte® does not require individual cell counting for this workflow. Instead, it quantifies the stained cell area in the analyzed region, which provides a practical and reproducible readout for stained transwell membranes.
For a full explanation of the biological difference between migration and invasion assays, read our Transwell migration and invasion assay guide.
What it measure?
Multiple readouts. One image.
No staining required. Your cells stay intact for downstream workflows.
Stained area %
Percentage of image area covered by crystal violet-stained invaded cells. Primary invasion readout.
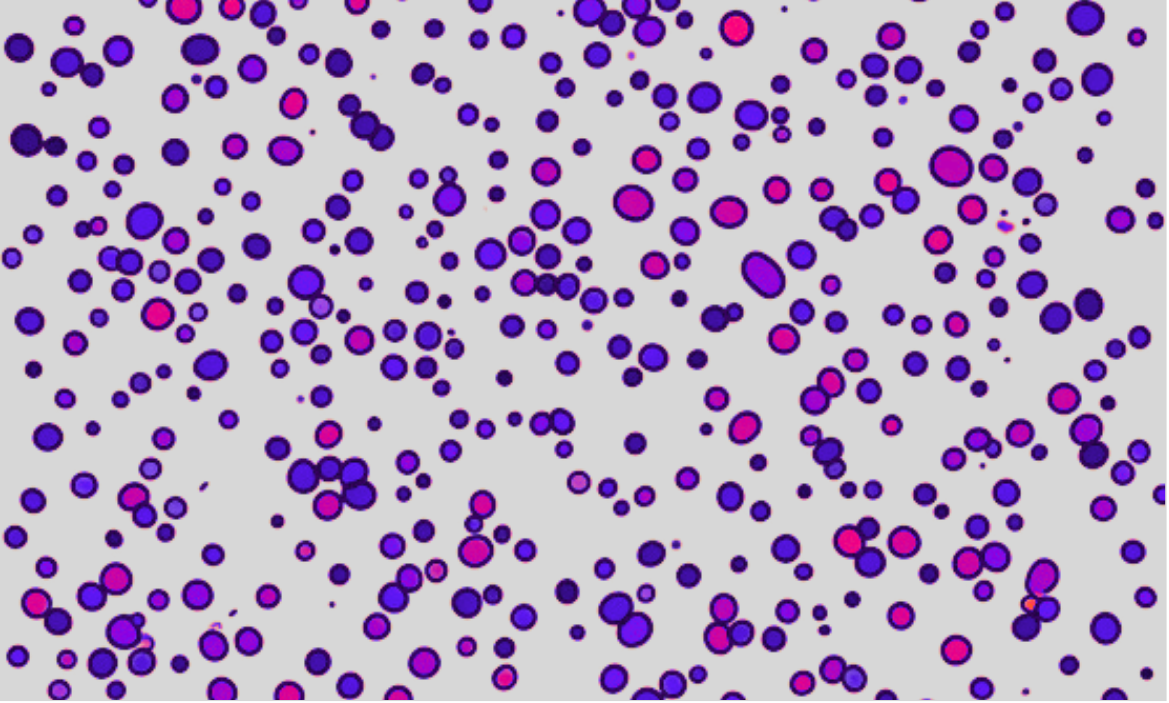
Image overlay or mask
Image overlay of detected cells you can use in your presentatons/publications.
Group comparisons
Mean and SD across treatment vs. control or different cell lines, automatically calculated.
ROI-restricted analysis
Draw an ROI to restrict analysis to the membrane area only, excluding black background.
When to use it
Common use cases
Drug response
Measure the effect of a drug on invasion/migration.
Cell line comparison
Compare invasive potential across different cell lines or genetic backgrounds.
Reproducibility
Reduce manual counting and threshold adjustment and standardize readouts across all users.
Workflow
From bench to results in minutes
Stain and image
Remove non-invaded cells from the top, fix with 70% ethanol, stain with 0.1% crystal violet, wash thoroughly. Image the membrane at 10x with your phone or digital microscope both work. Take 4 images per well.
Upload and organize
Upload all images. Group by condition e.g. treatment vs. control, different cell lines.
Review and export
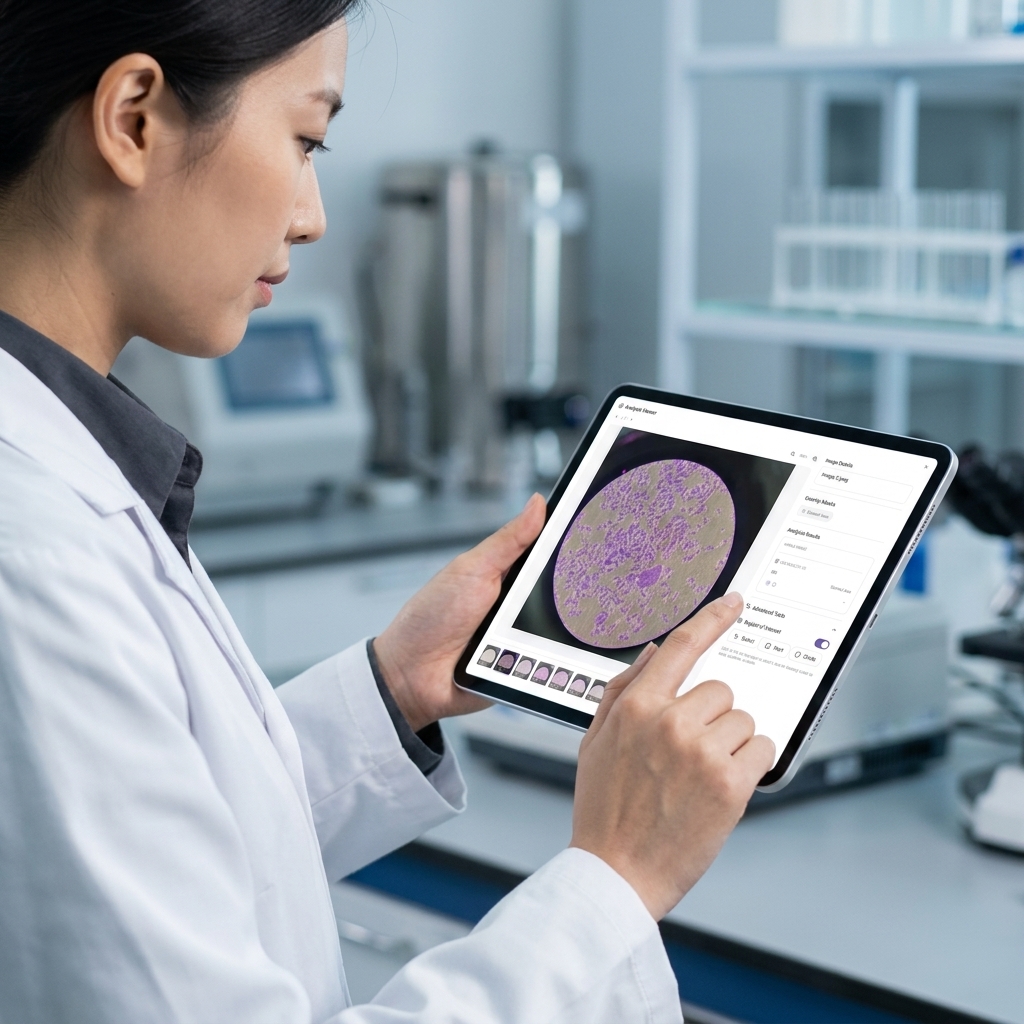
Spot check 3-5 images for accuracy. Stained area % per image, group comparisons with SD, exportable to Excel. Remove any images with uneven staining or imaging artifacts.
Example output
What your results look like
Why use stained-area quantification?
Manual counting can be slow and subjective, especially when cell boundaries are unclear or the membrane has uneven staining. Threshold-based tools can also produce inconsistent results when users adjust settings differently.
Stained-area quantification provides a standardized way to compare migration or invasion across groups. SnapCyte® applies the same trained analysis model across images, reducing user-dependent interpretation and improving reproducibility.
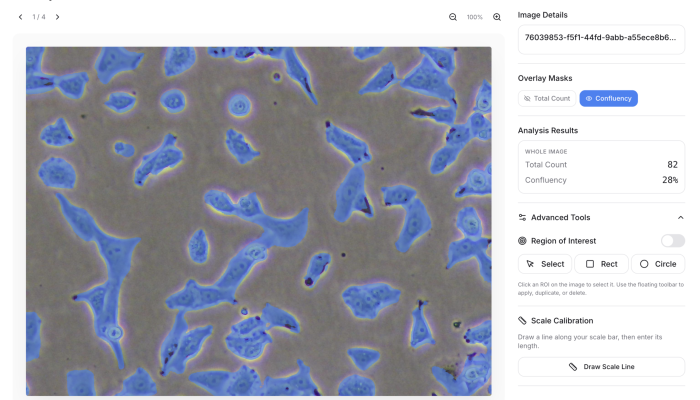
Transwell membrane stained with crystal violet. Stained area highlighted in blue. ROI restricts analysis to the membrane. Result: 64% stained area within ROI.
Tips
- Washing is critical, excess crystal violet on the membrane is the most common source of error. Wash thoroughly and check visually that the background is clear before imaging.
- Always make sure there is a ROI to exclude the black background, any empty area included will lower your stained area % artificially.
- Keep lighting consistent across all wells. Uneven lighting makes lightly stained areas appear unstained.
- If imaging with your phone, keep track of which well you're imaging before moving to the next one.
Case study
Used in real research
“SnapCyte™ integration has significantly enhanced the precision and efficiency of our invasion assays, providing a solid answer compared to our previous data analysis challenge.”
Track Cell Growth From Images
Sign up free. Get 25 credits. No credit card required.
Frequently asked questions
Most Frequent Questions and Answers
How does SnapCyte™ improve the accuracy of invasion assays?
SnapCyte™ enhances accuracy by providing an stained-area based assessment of cell invasion, reducing the subjectivity and variability associated with manual counting.
Can I use SnapCyte™ with any type of transwell insert?
Yes, SnapCyte™ is compatible with a variety of transwell inserts, making it adaptable to different experimental setups.
What magnification is recommended for capturing images?
You can use 4X or 10X magnifications to acquire images. However, SnapCyte™ is optimized for 10X magnification, which balances detail and field of view for accurate analysis.
How long does it take to analyze the images with SnapCyte™?
SnapCyte™ processes each image in under 30 seconds, providing rapid results without compromising accuracy. Taking pictures of a 24-well plate would take around 15-20 minutes.
What kind of data output can I expect from SnapCyte™?
SnapCyte™ provides detailed quantitative data, including the percentage area of migratory (stained) cells and graphical representations of your results with various statistical analysis, ready for publication or further analysis.