How many times have you paused before counting adherent cells, knowing what comes next?
Detach the cells –> Neutralize trypsin –> Spin –> Resuspend –> Count –> Reseed and assume they will reattach and recover normally.
This workflow has been standard in cell biology for decades. It is practical and familiar, yet inherently disruptive. Enzymatic detachment alters cell matrix interactions, temporarily affects signaling pathways, and introduces handling variability. In tightly controlled experiments, that step can become a hidden source of noise.
Many of us have also relied on visual estimation:
“About 70% confluent.”
“Roughly a million cells.”
Not because of poor rigor, but because the method itself requires disruption. When measurement depends on disturbing the cells, approximation becomes part of the workflow.
Image based adherent cell counting addresses this limitation. It changes counting from a disruptive intervention into a non-invasive measurement. Routine microscopy becomes a quantitative platform, and a simple image becomes rich single cell data that approaches a flow cytometry style readout directly on adherent cultures.
Instead of interrupting biology to quantify it, we can now measure cells in place while preserving biological context and gaining deeper insight.
The Simple Concept
The principle is straightforward.
- Capture representative brightfield or fluorescence images without disturbing the cells.
- Determine the field of view (FOV) area in mm².
- Segment and count the cells within that defined area.
- Extrapolate to the total vessel surface area.
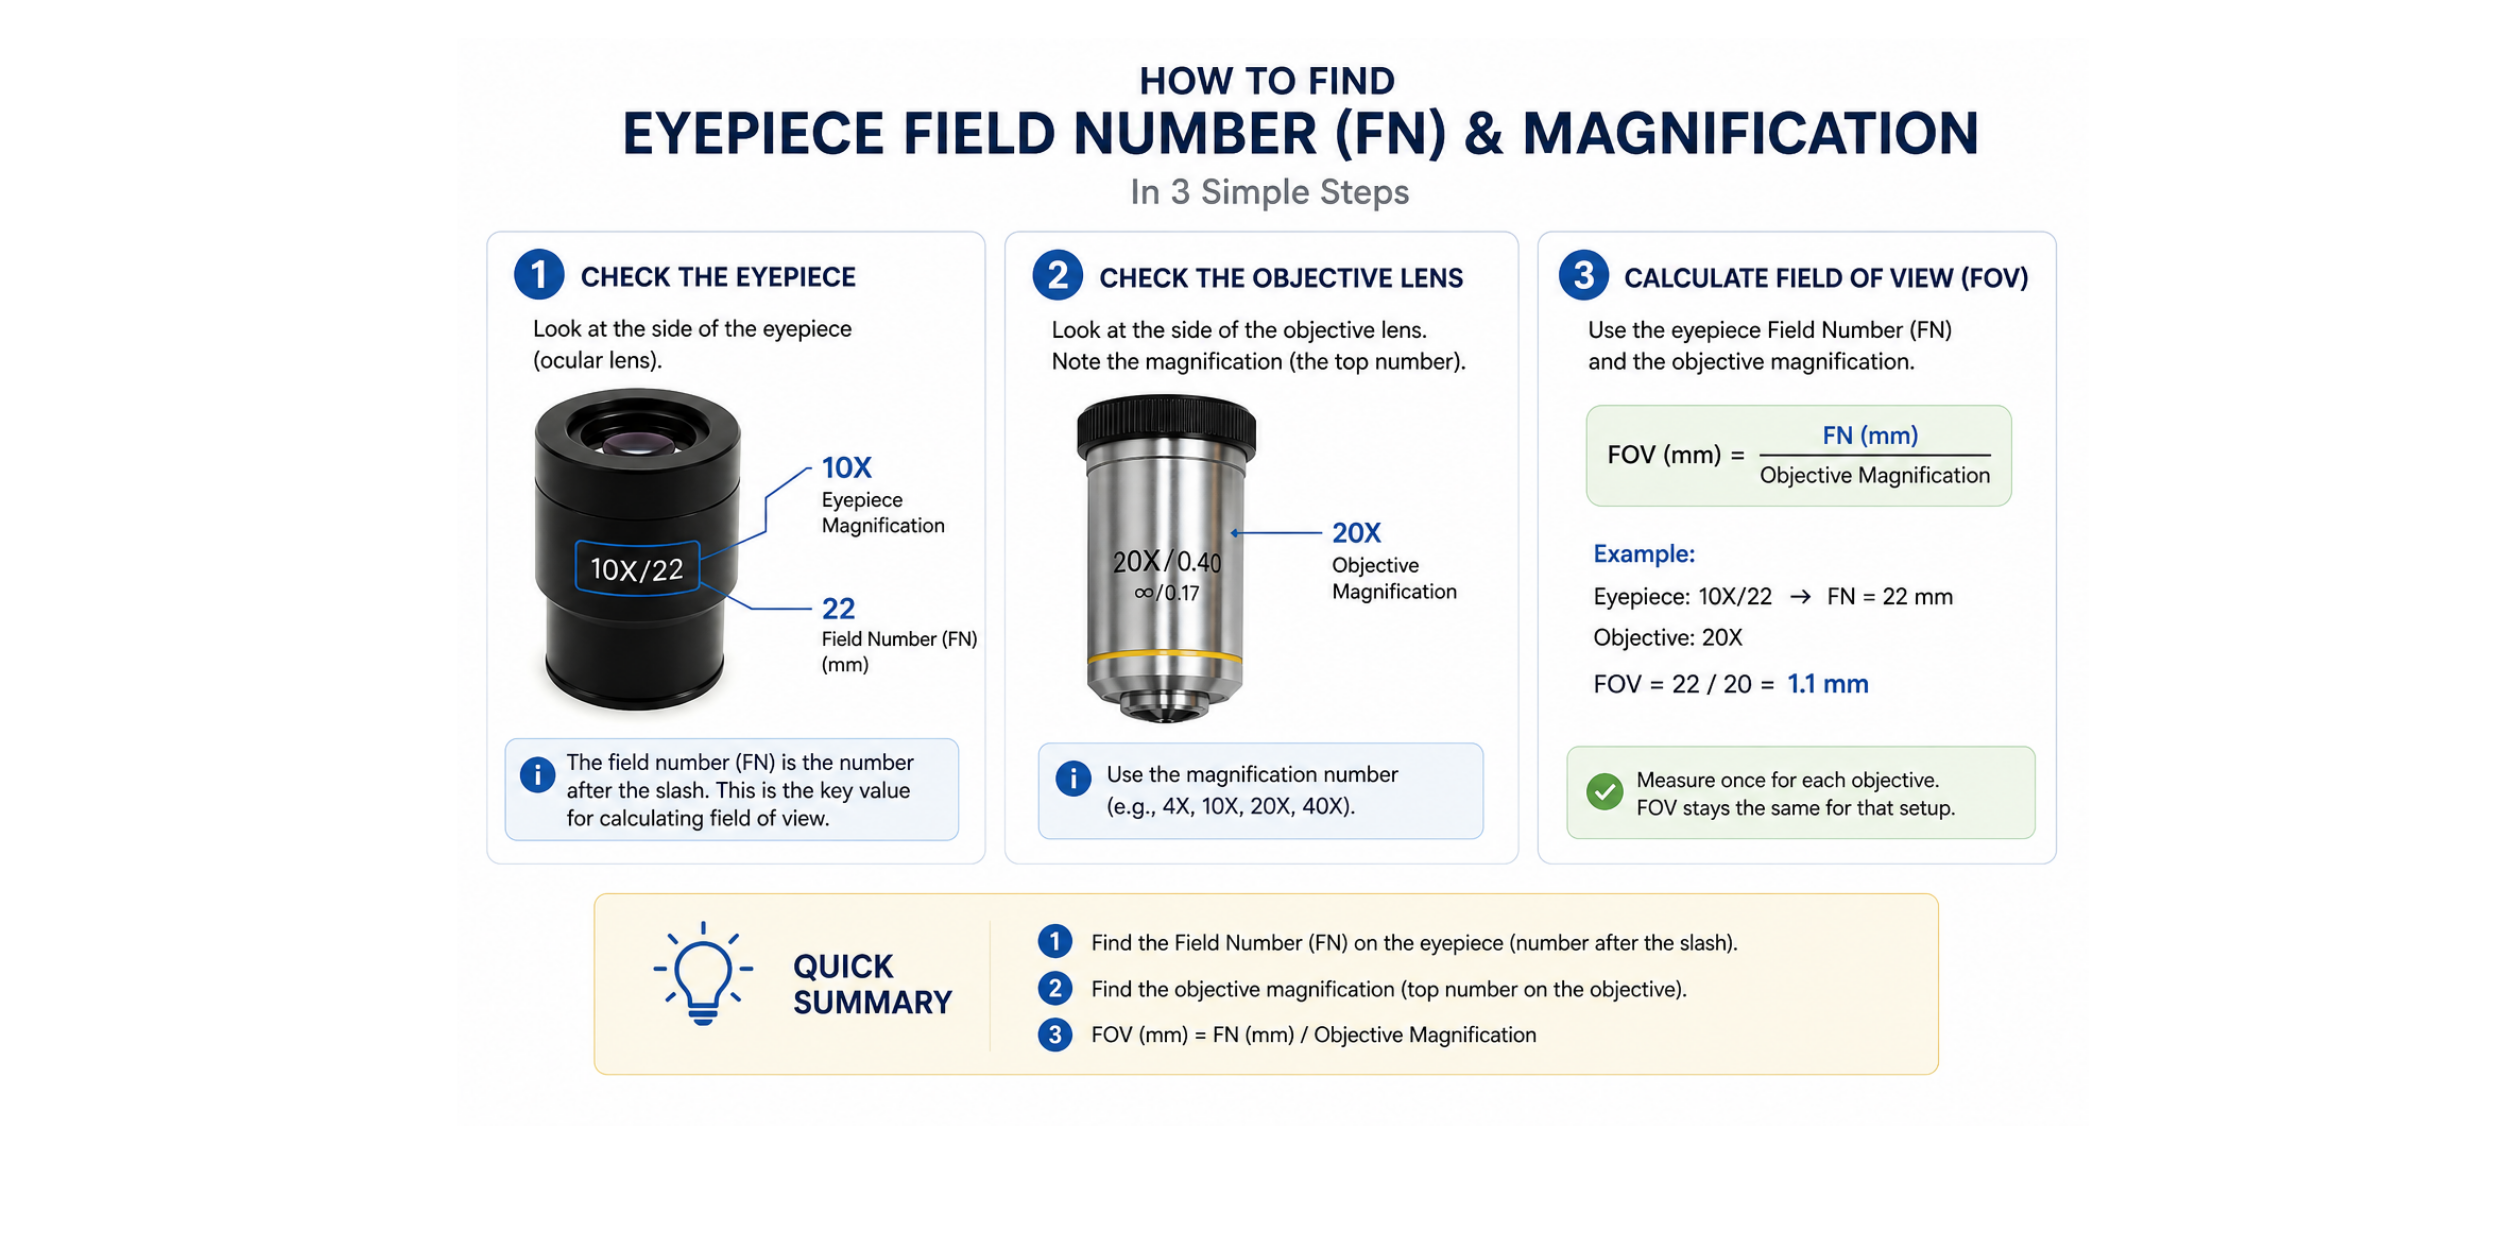
The FOV area can be calculated from the field number of the eyepiece and the objective lens magnification, measured directly using a stage micrometer, or taken from a calibrated digital microscope system when available. Once calibrated for a given imaging setup, it remains consistent.
If you are using a standard optical microscope, you can estimate the analyzed image area from the eyepiece field number and objective magnification. This gives the field of view (FOV) area, which can then be used to calculate cell density.
The calculator below can help with this calculation. You can usually find the eyepiece field number printed on the eyepiece, often shown as FN, field number, or a number such as 18, 20, 22, or 25.
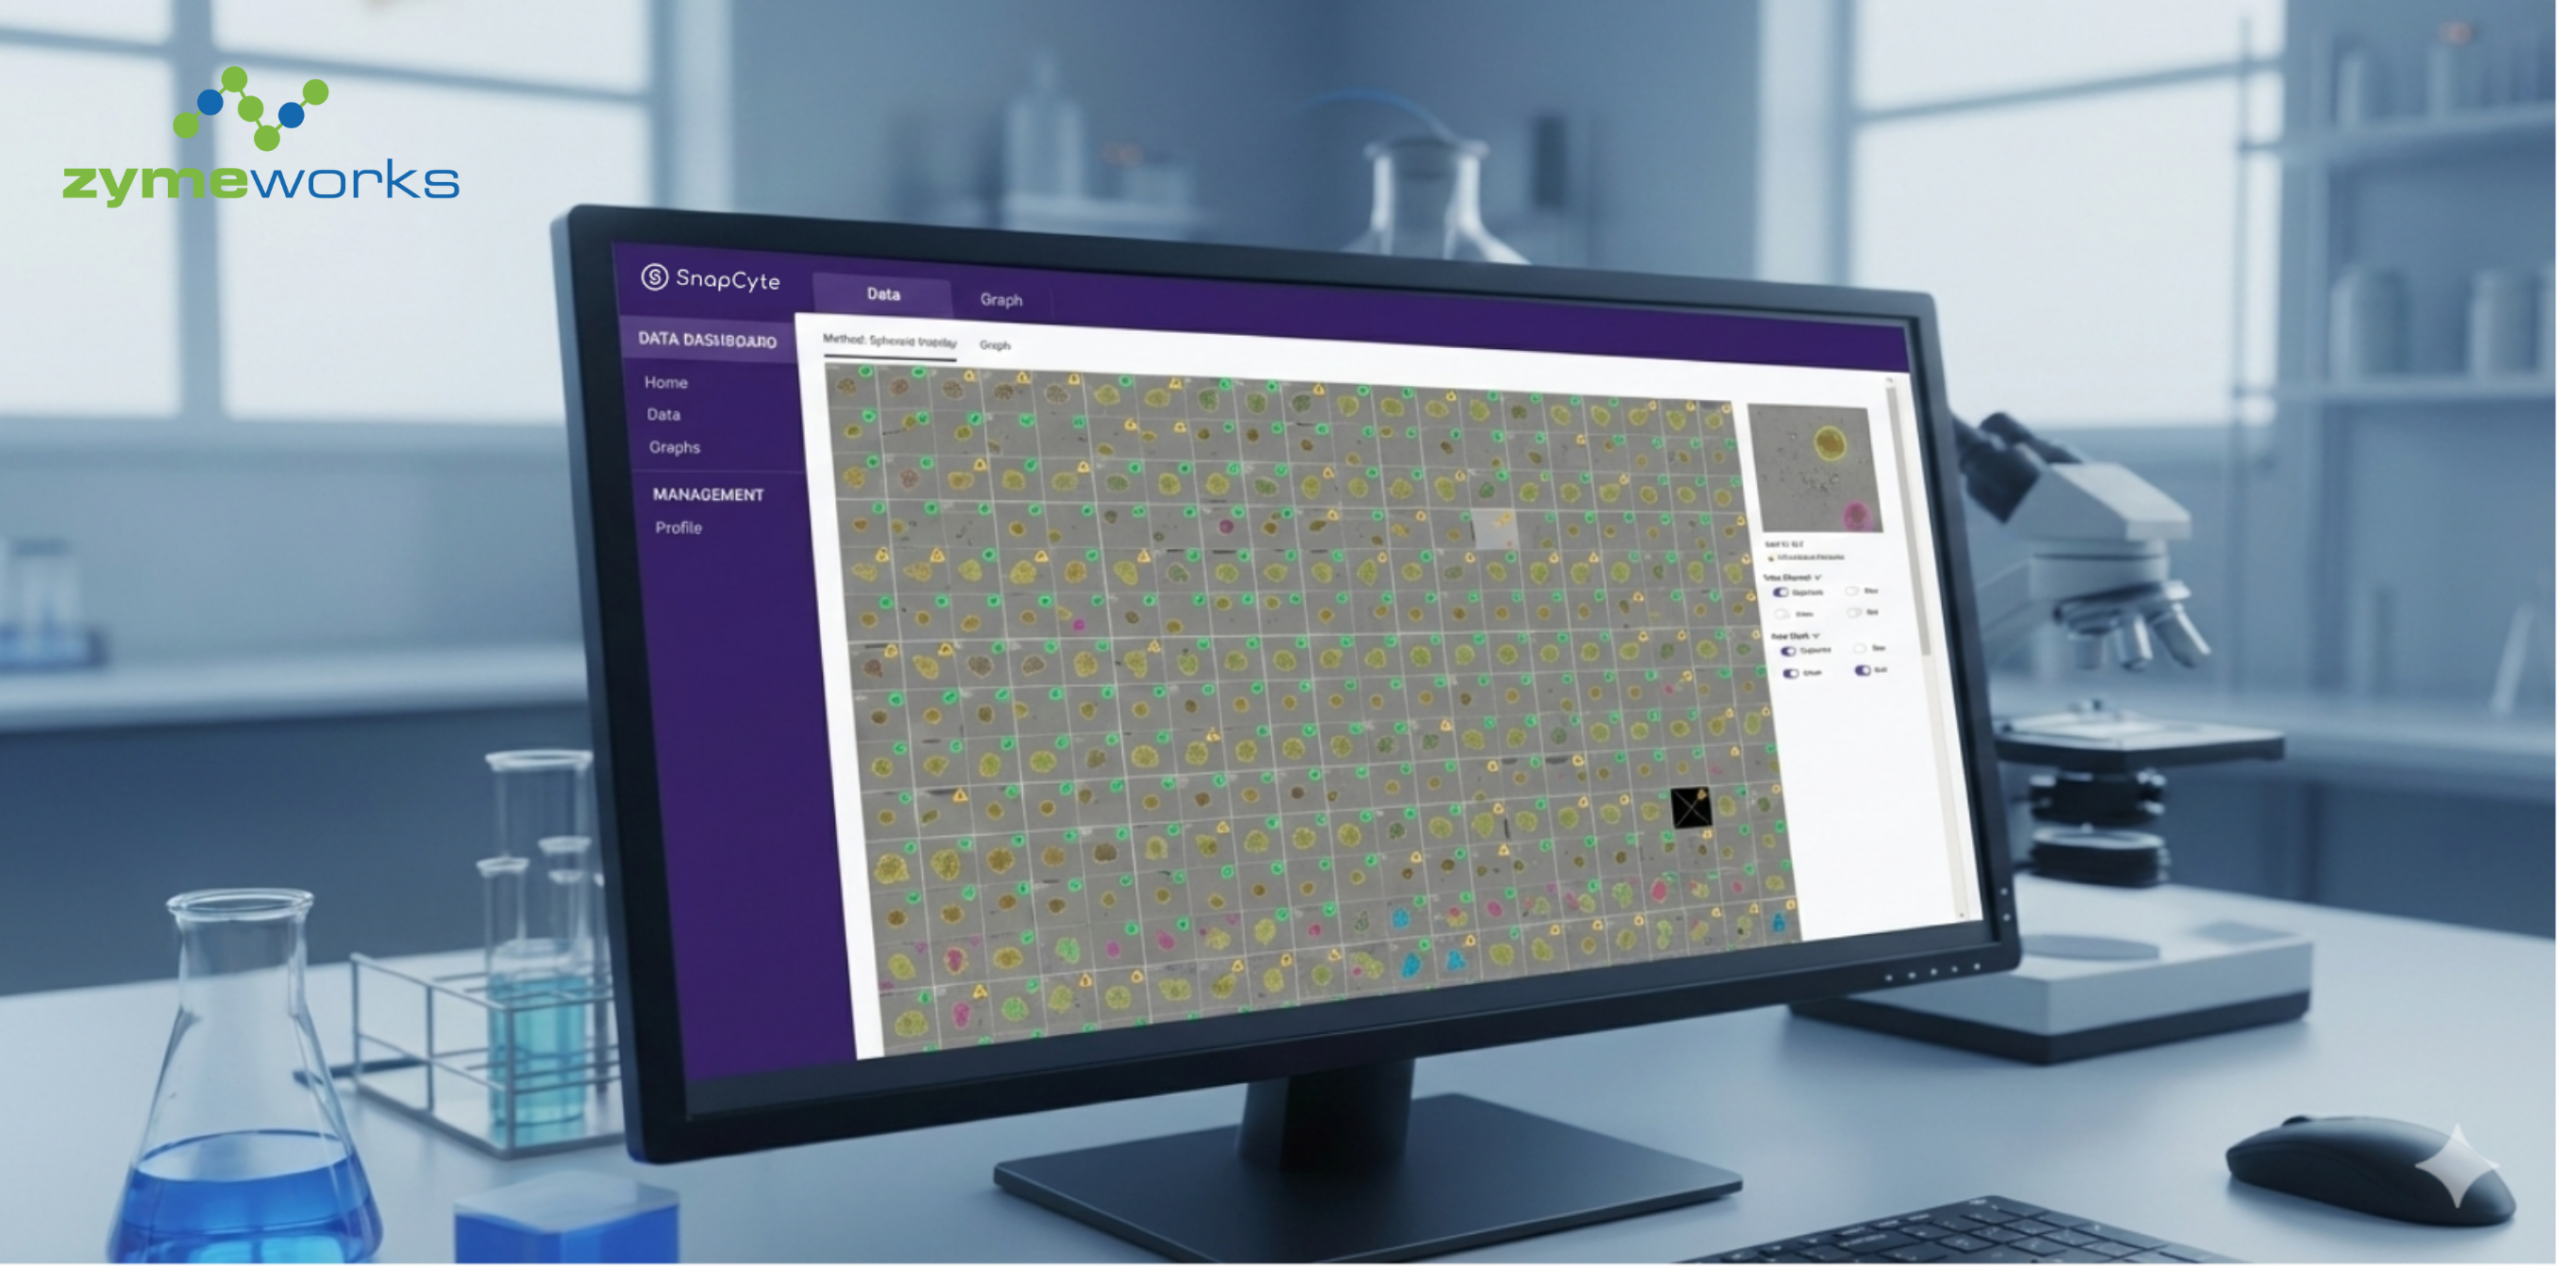
If you are using SnapCyte®, you may already have the cell density output as cells/cm². In that case, you do not need to calculate the FOV manually. You can use the SnapCyte® cells/cm² value directly in the calculator below to estimate the total cell number in the vessel.
No detachment. No enzymatic stress. No recovery period.
But the real value begins after segmentation.
Adherent Cell Count Estimator
Use this calculator to estimate total adherent cell number from either a manually calculated microscope field of view or a SnapCyte® cell density output. If you are using a standard optical microscope, enter the eyepiece field number, objective magnification, counted cells, and total growth area in mm². If you already have a SnapCyte® result in cells/cm², enter that value with the total vessel growth area in cm².
FOV diameter: mm
FOV area: mm²
Cell density: cells/mm²
SnapCyte® cell density: cells/cm²
Estimated total cell number: cells
From Counting to Quantification
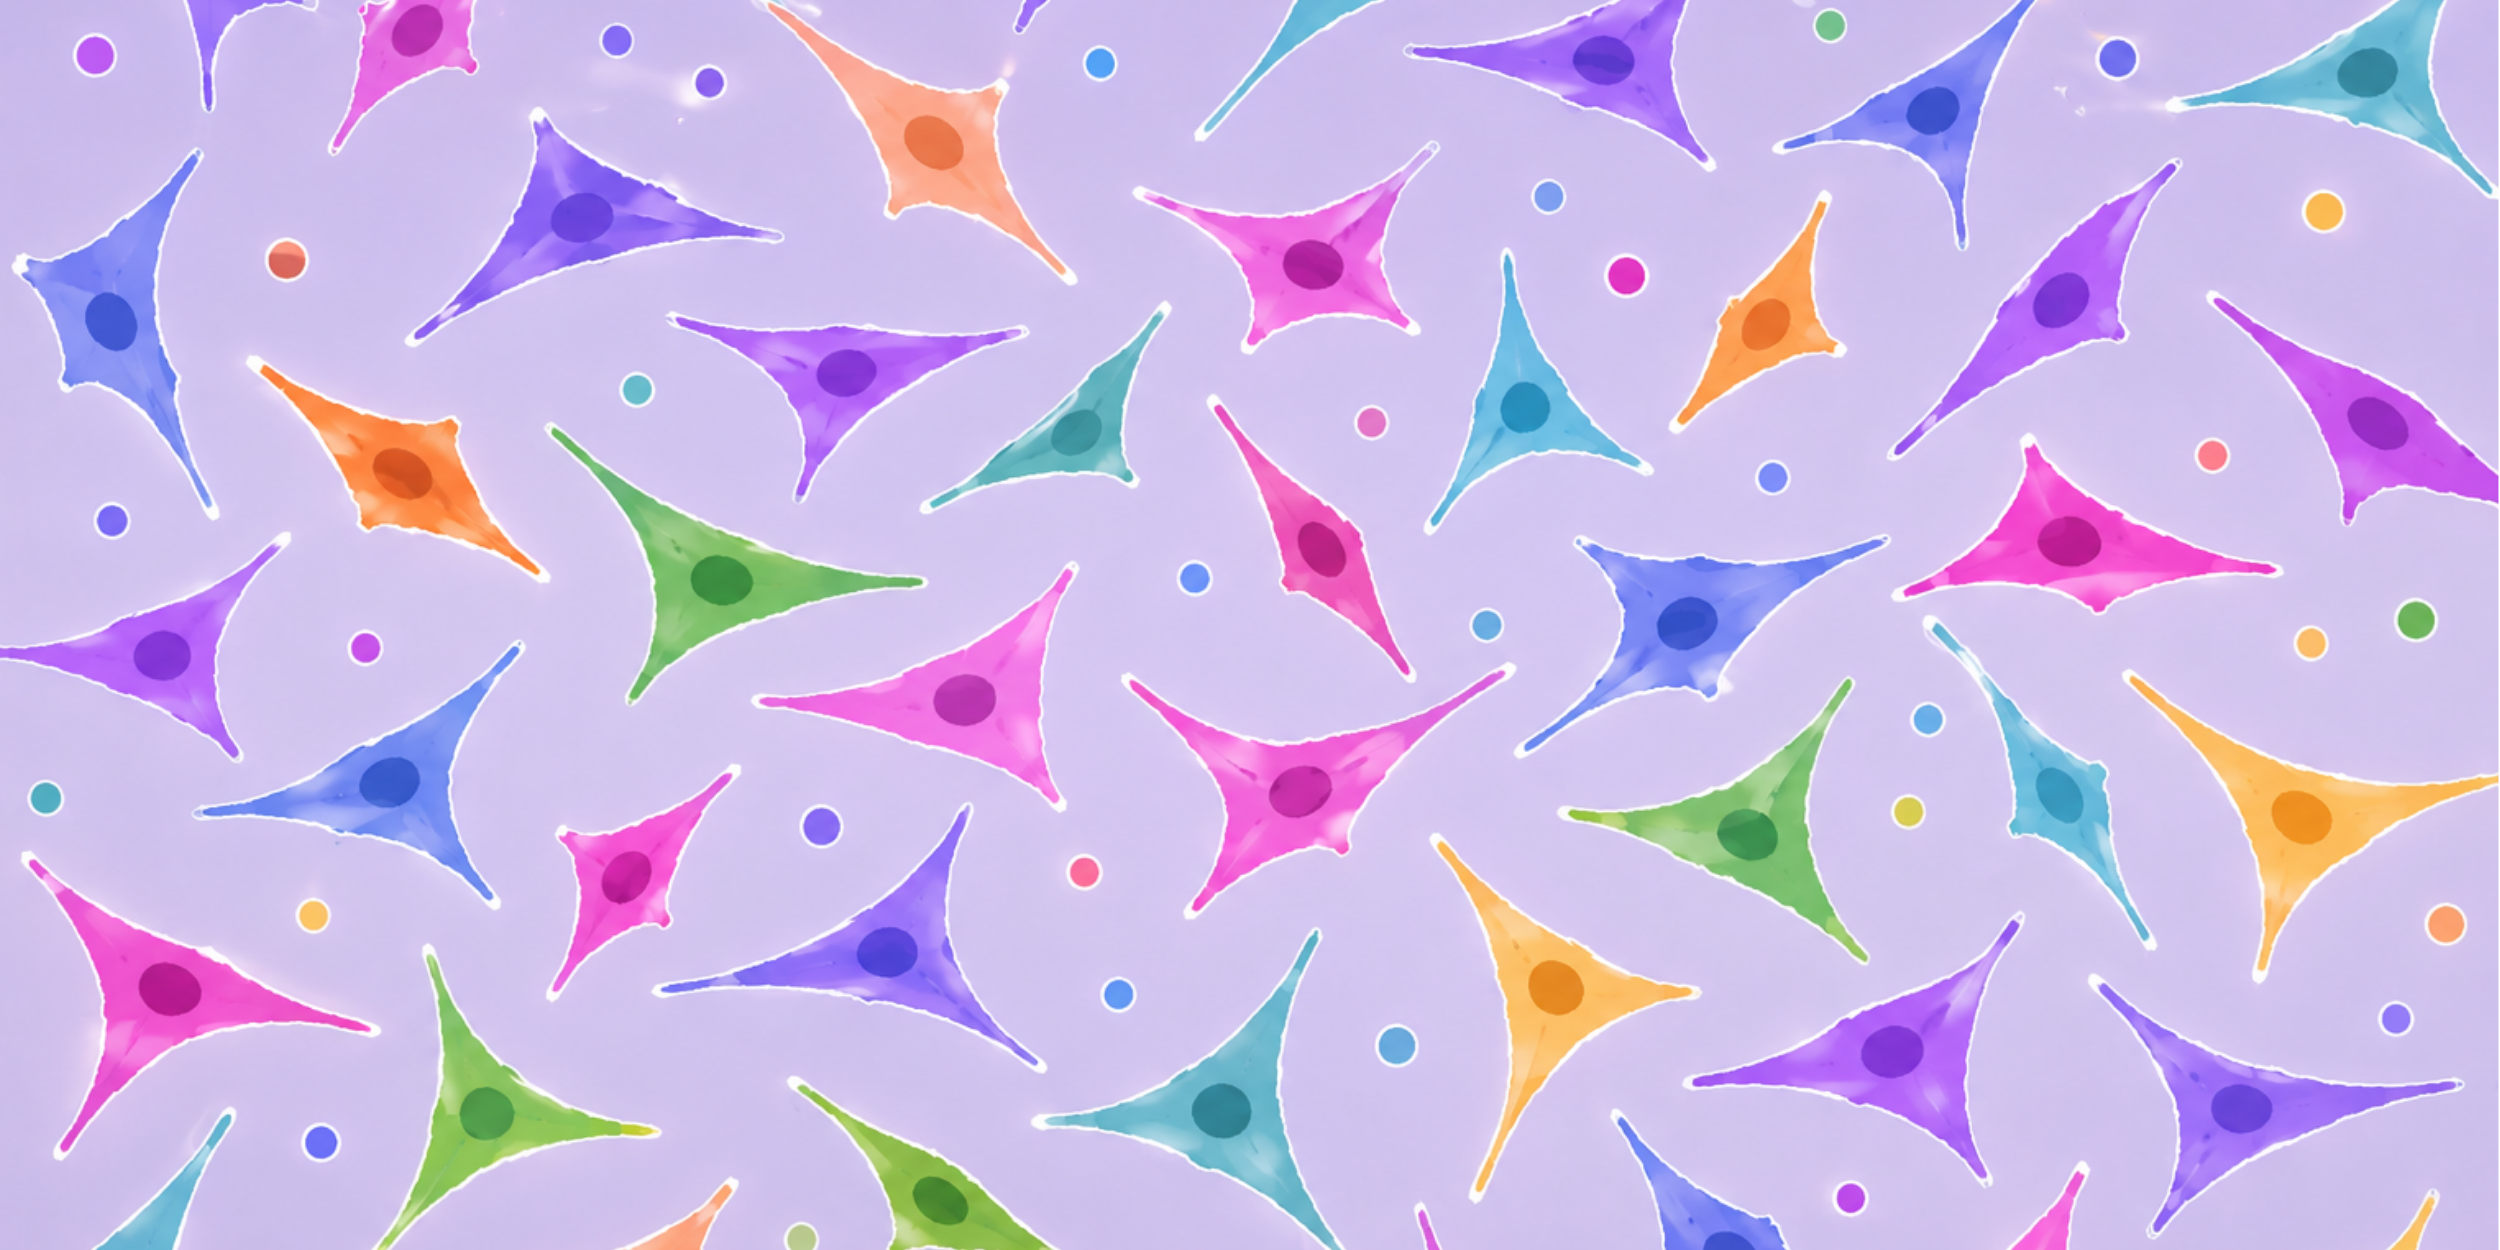
Once individual cells are segmented, every cell becomes a measurable object. Area, circularity, perimeter, fluorescence intensity, and spatial position can all be quantified at single cell resolution.
This creates practical advantages for real laboratory workflows.
Real Lab Advantages
Application / Use Case | Why Image-Based Counting Helps | Key Benefit |
1. Preserve Biology Before Downstream Assays | If you are studying membrane proteins and planning to lyse cells for Western blot, trypsinization can cleave surface proteins and alter signaling. With image-based counting, cells are quantified directly in the well and lysed immediately afterward. No enzymatic exposure, no recovery period, and reduced artificial variability. Similarly, in RNA-seq experiments, enzymatic detachment can transiently alter transcriptional profiles, so counting without detachment helps reduce pre-analytical noise. | Preserves native cellular biology and minimizes assay-induced artifacts. |
2. Working With Primary Cells, iPSCs, or Stem Cells | In primary neuron cultures or iPSC-derived cells, detachment can introduce substantial stress or cell loss. During drug treatment preparation, imaging allows direct quantification of cell density on the plate and adjustment of treatment concentrations (e.g., MOI) without disturbing fragile cultures. | Protects sensitive cell types while maintaining accurate normalization. |
3. Cell Cycle and Mitosis Tracking | In synchronized cultures, mitotic cells become more rounded and smaller in projected area. By analyzing circularity and size distributions, it is possible to estimate when a population enters mitosis. For example, after thymidine block synchronization, a shift toward higher circularity and reduced spread area can guide optimal collection timing before confirmation with additional assays. | Enables non-destructive monitoring of mitotic progression. |
4. Studying Anoikis or Adhesion | During detachment-induced apoptosis (anoikis), cells lose adhesion, round up, and shrink before fully detaching. Instead of relying only on visual observation, image analysis can quantify increases in circularity and reductions in spread area across the population. | Provides quantitative morphology-based assessment of adhesion loss and apoptosis. |
5. Detecting Rare or Abnormal Cells | In drug-treated cancer cultures, mitotic catastrophe may produce enlarged or multinucleated cells. By plotting single-cell area distributions, these outlier populations become quantitatively identifiable rather than only visually noticeable. Instead of reporting “some large cells,” researchers can define a measurable subpopulation above a specific size threshold. | Detects rare phenotypes and abnormal populations quantitatively. |
6. Seeding Uniformity and Density Control | In proliferation assays using 96-well plates, uneven seeding can distort downstream growth curves. Image-based analysis reveals clustering, edge effects, and true density (cells/mm²), allowing verification of uniformity before beginning the experiment. | Improves reproducibility and experimental consistency. |
7. Clonogenic Growth | In colony formation assays, segmentation and spatial analysis allow identification of clusters and measurement of colony compactness. In stem cell cultures, colony density and compactness may reflect differentiation state, which is often assessed qualitatively but can now be quantified. | Enables objective measurement of colony morphology and growth patterns. |
8. Migration and Invasion Assays | In scratch assays, wound closure may result from migration, proliferation, or both. By measuring wound area alongside total cell count, migration can be normalized to cell number. This is especially useful when proliferation inhibitors do not fully suppress growth. | Separates migration effects from proliferation effects. |
9. Turning Microscopy Into Flow-Like Analysis | When fluorescent reporters such as GFP are used in transfection or CRISPR experiments, segmentation enables single-cell fluorescence quantification directly on adherent cultures. Researchers can count total cells, count GFP-positive cells, and calculate transfection efficiency without detaching cells for flow cytometry. Similarly, protein expression changes can be measured at single-cell resolution in fixed or live samples. Routine imaging becomes a flow-style analytical too | Enables flow cytometry-like quantitative analysis directly from microscopy images. |
From Manual Counting to Standardized Measurement
Because cell counting often depends on visual interpretation, it is inherently user-dependent. Differences in how researchers interpret debris, clumping, or borderline cells can introduce variability across experiments.
This is exactly the type of measurement problem that image-based analysis is designed to address.
By applying consistent segmentation rules across images, AI-driven image analysis reduces subjectivity and enables reproducible quantification across users, time points, and experiments.
This is where AI image analysis for cell biology becomes useful: it turns routine microscopy images into standardized measurements that can be compared across users, time points, and experiments.
To Sum Up
Adherent cell counting is no longer simply about determining how many cells are present. It integrates number, morphology, spatial organization, and phenotype, without disturbing the system.
For a field long dependent on shape, size, and count, image-based adherent cell analysis brings those dimensions together into a single, quantitative, non-invasive framework.
Continue exploring
If you want to build a stronger foundation for reproducible cell measurements:
Try image-based analysis for cell growth, cell count, and assay quantification.
Sign up free. Get 25 credits. No credit card required.

")
")
")