What cell confluency is and how it’s measured?
In cell culture, cell confluency, the percentage of the vessel surface covered by adherent cells, is one of the most widely used metrics. It’s the first thing we check when we open the incubator and often the last thing we note before going home.
If you work with adherent cells, your day is filled with familiar phrases: “Looks like ~50%—I’ll treat tomorrow,” or “Let’s scratch once it reaches 95%.”
We often treat cell confluency as a universal indicator of cell health, growth, and experimental readiness. Sometimes it is. But confluency measures percent area, which is a geometric measurement, while the outcomes we care about, proliferation, viability, differentiation, migration, and cytotoxicity, are biological. Geometry and biology often correlate, but they are not the same thing. The key is knowing when confluency reflects biology, when it misleads you, and when it requires a complementary readout such as adherent cell count.
What is cell confluency?
Let’s define it clearly.
Cell confluency is the fraction of the two-dimensional culture surface covered by adherent cells, expressed as a percentage. It describes space occupancy, not cell number and not cell health. Importantly, cell confluency is not the same as cell density.
Confluency refers to percent area covered. Cell density refers to the number of cells per unit area (or volume). Two cultures can appear to have the same confluency while containing very different numbers of cells, because changes in cell size, spreading, clustering, or layering can alter surface coverage without changing cell number. This distinction explains many common errors in interpreting confluency-based assays. For a deeper breakdown of these concepts, see Everything You Need to Know About Cell Confluency.
How do you measure cell confluency?
Many laboratories still estimate confluency by eye, which introduces subjectivity and reduces reproducibility. One researcher’s 70% confluency may be another’s 85%, and even the same researcher can vary from day to day. Read more here.
Today, cell confluency can be measured objectively and reproducibly using modern image-analysis tools applied to brightfield or phase-contrast microscopy images. Tools like SnapCyte provide consistent, reproducible measurements without user bias. Today, the main limitation is no longer the ability to measure it, but how the measurement is interpreted and used.
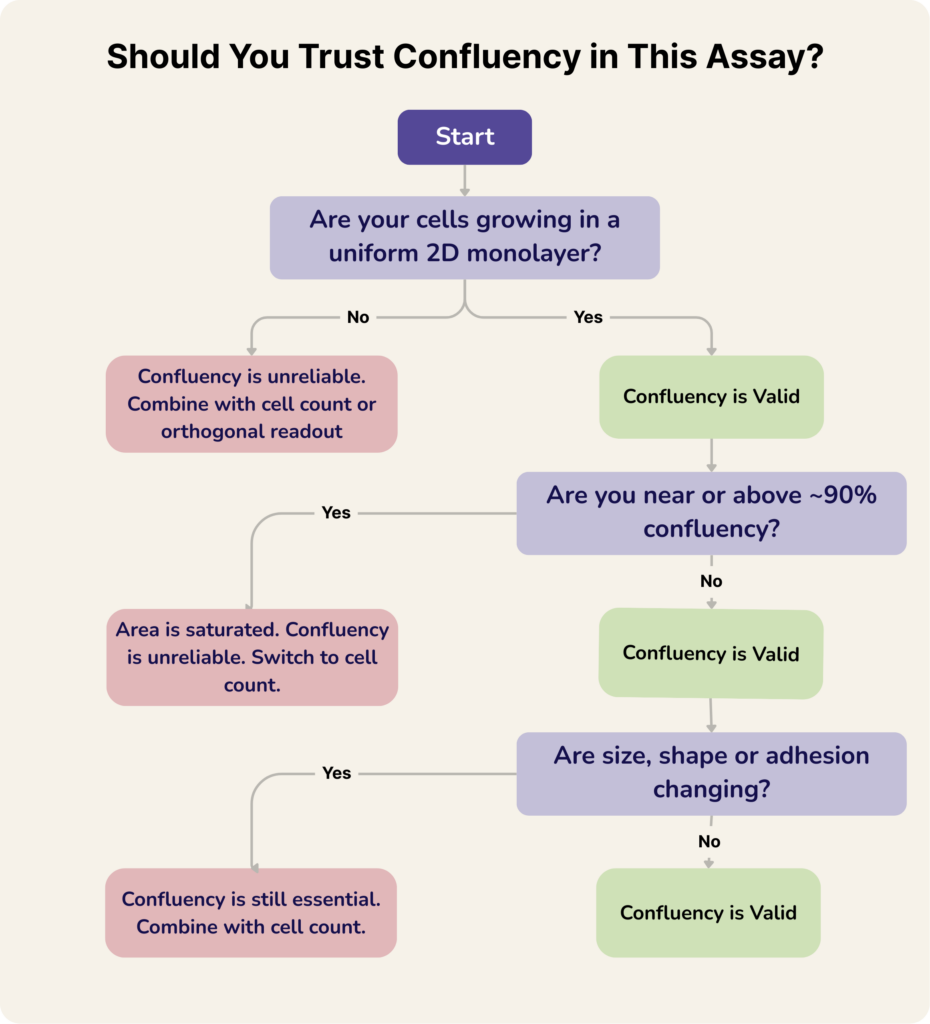
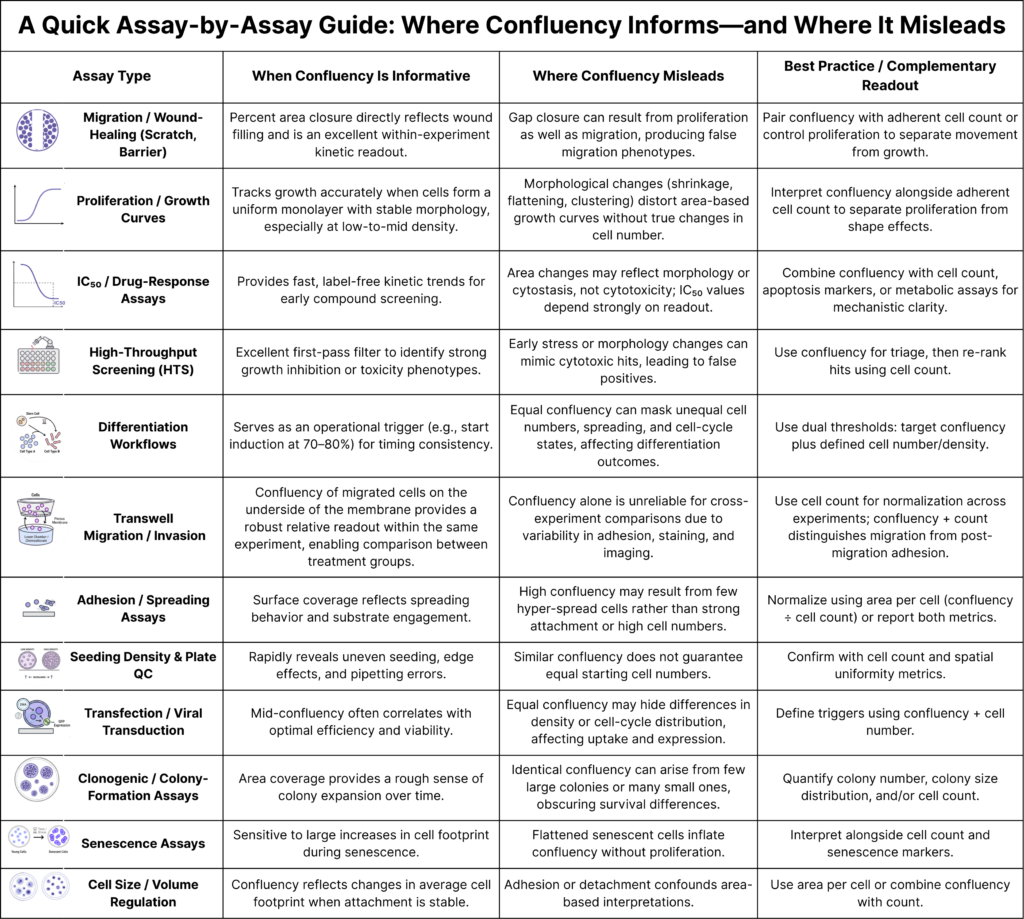
Below are some common concerns about confluency and when it is informative, where it becomes unreliable, and how to interpret it correctly in real experimental workflows
Can you use cell confluency to estimate proliferation?
Yes—in most cases, but only within a specific window where monolayers behave predictably.
Consider a classic adherent cell line growing as a smooth, even monolayer. During exponential growth, individual cells tend to maintain a relatively consistent footprint as they divide. In this ideal scenario, the geometry is simple: more cells mean more covered area, so confluency rises in parallel with cell number. This is the regime where confluency curves can approximate growth curves and where doubling-time estimates are reliable.
The problem is that this “clean” relationship is not a law of nature. It is a conditional convenience. It holds best in the mid-range of growth—when cells are neither too sparse nor approaching saturation—and only as long as cell morphology remains stable.
The moment cells stop behaving like a uniform two-dimensional carpet, confluency stops behaving like a growth meter. Many cell lines mound or cluster. Some stem-cell derivatives compact or begin a subtle drift toward three-dimensional behavior. And as cultures approach full surface coverage, confluency begins to plateau—even while cells continue dividing beneath the surface.
If you want to use confluency as a proliferation readout, the best approach is calibration. Measure confluency and adherent cell count together across a range of densities, identify the region where confluency tracks cell number, and treat that region as your valid window. Inside this window, confluency is fast, efficient, and informative. Outside it, cell counting—or another orthogonal biological readout—must take over.
Modern imaging tools, such as SnapCyte, make this practical by extracting both confluency and adherent cell count from the same image, allowing the valid window to be defined empirically rather than assumed.
This is also where confluency is frequently misused as a proxy for seeding density accuracy. Confluency can reveal whether a plate is obviously too sparse, too crowded, or unevenly seeded. However, it cannot guarantee matched cell numbers across wells when cell shape varies. Combining confluency with adherent cell count resolves this ambiguity and allows you to determine whether two cultures that look similar are in fact biologically equivalent.
Calibrate Proliferation, Don’t Guess
Use SnapCyte to pair confluency with adherent cell count from the same brightfield image to define valid growth windows and improve reproducibility.
When can cell confluency be misleading?
Confluency becomes misleading whenever space occupied no longer reflects the biological quantity you think it reflects.
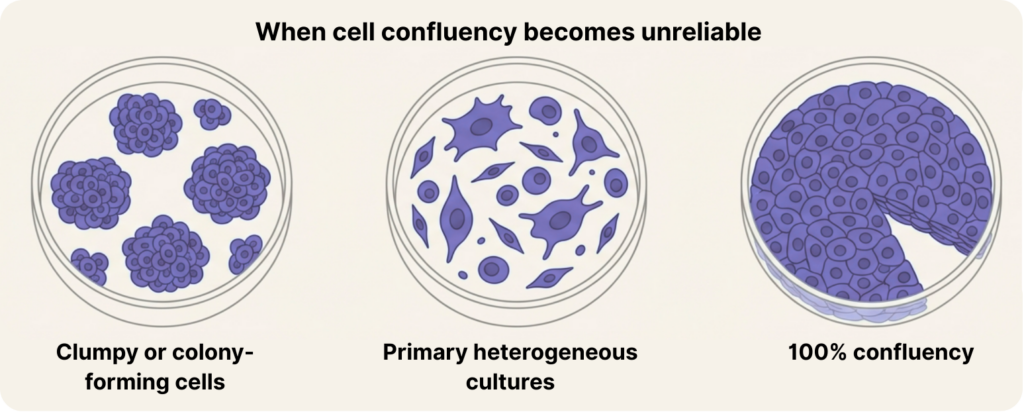
A classic failure mode is clumpy or colony-forming cells. When cells grow in clusters, confluency is really measuring the footprint of aggregates, not the number of cells inside them. A few large, spread clusters can inflate confluency while total cell number remains low. Conversely, many compact colonies can contain a lot of cells while covering surprisingly little area. In these systems, confluency can drift away from biology quickly, even if your confluency measurement is perfectly “accurate.”
Another major source of error is primary cultures. Primary cells are often heterogeneous in size and shape, irregular in spreading, and inconsistent in attachment. That means “80% confluency” can represent very different densities, and those differences can translate into real changes in signaling, stress response, and differentiation propensity. This is why confluency is often less reliable for rough/primary morphologies than it is for well-behaved immortalized cell lines.
Even in well-behaved cell lines, confluency starts to mislead at the high end. Near saturation, it gives you an illusion of completion. A culture can sit at “100% confluency” while continuing to increase in cell number through stacking, compression, or multilayer growth.
Finally, confluency can be a misleading trigger threshold (starting point). Many protocols define a confluency window—often 50–60%—to initiate treatment, stimulation, or the start of an experimental protocol. This approach can work reliably only if confluency corresponds to a consistent biological state in that specific system.
Where this breaks down is when identical confluency reflects different histories rather than equivalent biology. For example, two plates may both appear at ~50% confluency and therefore trigger the start of an experiment. However, one plate may have been seeded at low density and reached 50% after 72 hours, while the other was seeded at a higher density and reached the same confluency after only 12 hours. Although the geometric readout is identical, the cells are clearly not in the same physiological state—cell-cycle distribution, stress signaling, adhesion dynamics, and density-dependent pathways are likely very different. In this scenario, confluency is misleading as a trigger.
Confluency can be used effectively as a trigger only when all other parameters are preset, validated, and equivalent across conditions—including seeding density, time post-seeding, growth rate, and morphology. When those constraints are controlled, confluency becomes a practical and reproducible operational threshold. When they are not, it risks synchronizing experiments by appearance rather than by biology.
Does cell confluency correlate with viability?
Sometimes, and it is the sweet spot for high throughput screening assays, but not reliably enough to use it as the only viability decision tool.
A drop in confluency is often interpreted as “cells are dying.” or less growth. But confluency can decrease because cells shrink, round up, retract their cytoskeleton, or change adhesion—without any true loss of viability. Early apoptosis can reduce footprint hours before detachment, creating the appearance of “toxicity” before cell loss has actually occurred. On the flip side, cells can be metabolically compromised or committed to death while still attached and spread, keeping confluency deceptively high.
This is why confluency is best treated as a contextual signal, not a viability assay. If you are making a real decision—“is this drug cytotoxic or just altering shape?”—you need another readout. That second readout might be an adherent cell count curve, apoptosis markers, metabolic measurements, or direct viability staining depending on the biology you care about. The key is to avoid using confluency alone as a surrogate for survival unless you’ve validated that link in your system.
Should confluency be used for normalization in assays?
Confluency is often used to normalize readouts because it feels like it should correct for “how many cells are present.” The problem is that confluency doesn’t cleanly represent cell number. It represents a mixture of cell count, cell area, adhesion state, compaction, and sometimes vertical stacking. So normalizing by confluency can accidentally normalize by morphology rather than by population size.
This matters most in assays where the biological state is sensitive to starting conditions—differentiation, transfection, stimulation protocols, secretion assays, and many imaging-based phenotyping pipelines. Two wells can have the same confluency but different densities, different cell-cycle distributions, and different degrees of contact inhibition. Normalizing by confluency in that situation can reduce variance in the spreadsheet while increasing variance in the biology.
A more reproducible pattern is to use confluency as a gate rather than the actual normalizer. Use it to ensure you are in a reasonable range (for example, mid-confluency where monolayers are stable), but pair it with a measurement that matches the biological variable you want to control, often a cell count/density estimate. Many labs find that using a dual threshold (“hit this confluency window and this cell count range”) stabilizes outcomes much better than confluency alone.
How do morphological changes affect confluency readings?
This is where confluency most frequently “lies,” because morphology can change dramatically before cell number changes at all.
Many treatments alter cell shape early. Cytoskeletal inhibitors can shrink cells, causing confluency to drop sharply without true cell loss. Taxanes can generate giant multinucleated cells, inflating area and making confluency look like “growth” when proliferation has stalled. Senescence can flatten cells into large footprints, mimicking accelerated expansion. Early 3D transitions can increase cell number while surface coverage barely changes. Early apoptosis can reduce footprint long before detachment.
This isn’t a minor technicality, this is exactly how growth curves get distorted and how IC₅₀ values shift depending on the readout. And it’s also why it’s so important to remember that IC₅₀ is not a fixed property of a drug. It depends on what biological phenomenon you measure. Area-based IC₅₀ blends morphology and cytostasis. Count-based IC₅₀ reflects population expansion or loss. Apoptosis markers measure a different endpoint entirely. Metabolic assays report energetic collapse. The same compound can legitimately yield different IC₅₀ values across these readouts because it is doing multiple things to the cells.
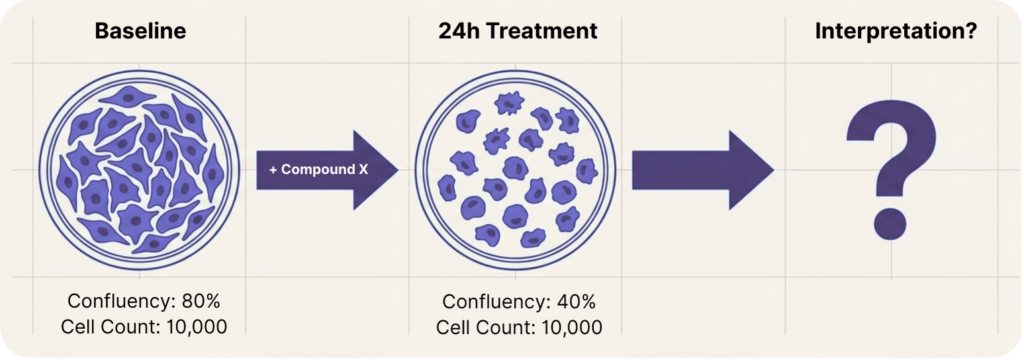
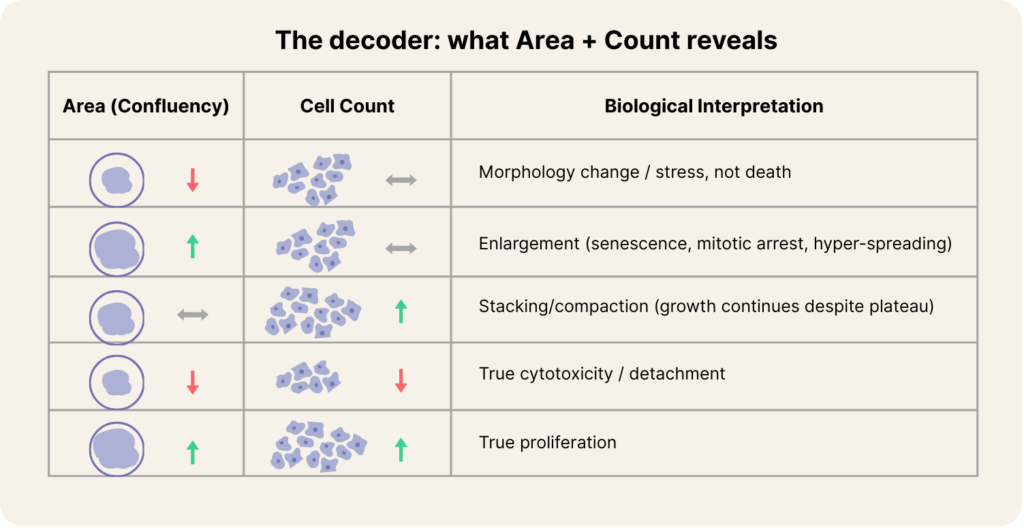
A practical way to regain interpretability is to pair confluency with adherent cell count and interpret the divergence. When area drops but count stays stable, you’re likely looking at a morphology phenotype or stress response rather than death. When area inflates but count stays flat, enlargement or arrest is likely dominating. When confluency plateaus but count rises, stacking or compaction is occurring. And when both area and count fall together, you’re finally looking at true cytotoxicity or detachment. In other words, the moment you stop treating confluency as “the biology” and start treating it as one axis of the biology, most confusion disappears.
Conclusion: Treat cell confluency as one instrument on the dashboard
Confluency remains one of the most useful tools in cell biology. It’s fast, intuitive, label-free, and often biologically meaningful. But it is not universal. It works beautifully when geometry and biology align; when they don’t, confluency becomes a distorted mirror that can misclassify mechanisms, shift IC₅₀ values, and reduce reproducibility—especially in clumpy systems, primary cultures, high-density conditions, and morphology-altering treatments.
The simplest upgrade is conceptual: treat confluency as a measurement of space, not a measurement of cells.
Confluency describes space.
Cell count describes biology.
Modern cell science requires both.
")

")


")